





New Brand Finance data reveals Germany leads the pullback, with its brands’ US share down more than any major European economy
LONDON, 15 October 2026 – Europe’s leading brands are becoming less reliant on the United States, with Germany leading the shift, according to new data from Brand Finance, the world’s leading brand valuation consultancy.
Germany remains the largest single-source of U.S.-attributable European brand value, at USD138.4 billion, but its U.S. share fell by almost 7 percentage points to just shy of 22%. This is the steepest decline of any major European economy and a key driver of the Europe-wide fall. The UK is the second largest contributor of U.S.-attributable brand value at USD87 billion, with its U.S. share down 2.3 percentage points to just under 18%.
Not every market is pulling back. Denmark, Belgium, Norway and the Netherlands all increased their U.S. exposure over the same period.
Across Europe, brands earned 17% of their brand value in the United States in 2026, down from 20% in 2024 – a decline of roughly 3 percentage points. That fall is equivalent to USD39.4 billion in lost U.S.-attributable brand value. Despite this pullback, the total value of European brands analysed grew 7% since 2024 to USD2.72 trillion in 2026.
A two-way cooling
The pullback is not one-sided. U.S. brands now derive 10% of their value from Europe, down from 11% in 2024. But the gap between the two remains wide: Europe is still roughly 1.7 times more exposed to America than America is to Europe, a gap of around 7 percentage points (17% vs 10%). Applied to European brands’ USD2.72 trillion total brand value, that gap is equivalent to around USD187 billion.
Semiconductors buck the trend
While most sectors are pulling back from the U.S., semiconductors moved sharply in the opposite direction. European chip brands increased their U.S. exposure by two-thirds, from under 14% to close to 23% – the largest sector increase recorded by Brand Finance, with this 23% exposure equivalent to USD3.8 billion. The move reflects both the scale of the U.S. market and Washington’s efforts to incentivise domestic chip production rather than relying on imported capacity.
Other sectors also leaned further into the U.S., including healthcare services, restaurants, and IT services. By contrast, sectors more commonly associated with exposure to U.S. trade policy – automobiles, auto components, apparel and pharmaceuticals – were among the sectors with the steepest falls in U.S.-attributable brand value share over the 2024-26 period. Pharma, however, remains the most U.S.-dependent of Europe’s major sectors by share, at 41%.
Mike Rocha, Managing Director, Europe & Americas, Brand Finance commented:
“Europe’s brands are quietly recalibrating their relationship with America. The transatlantic brand relationship is becoming less mutual. Both sides are pulling back, but Europe remains far more exposed to America than America is to Europe. That shift isn’t happening evenly, either – Germany is pulling back hard, while smaller markets like Denmark and Belgium are leaning in further. What’s striking is semiconductors are moving in the opposite direction to almost everything else, which tells you this is less about Europe turning away from the U.S. and more about where the American market is still pulling European brands in, and where trade pressures are pushing them out.”
Brand Finance Europe 500 2026 ranking
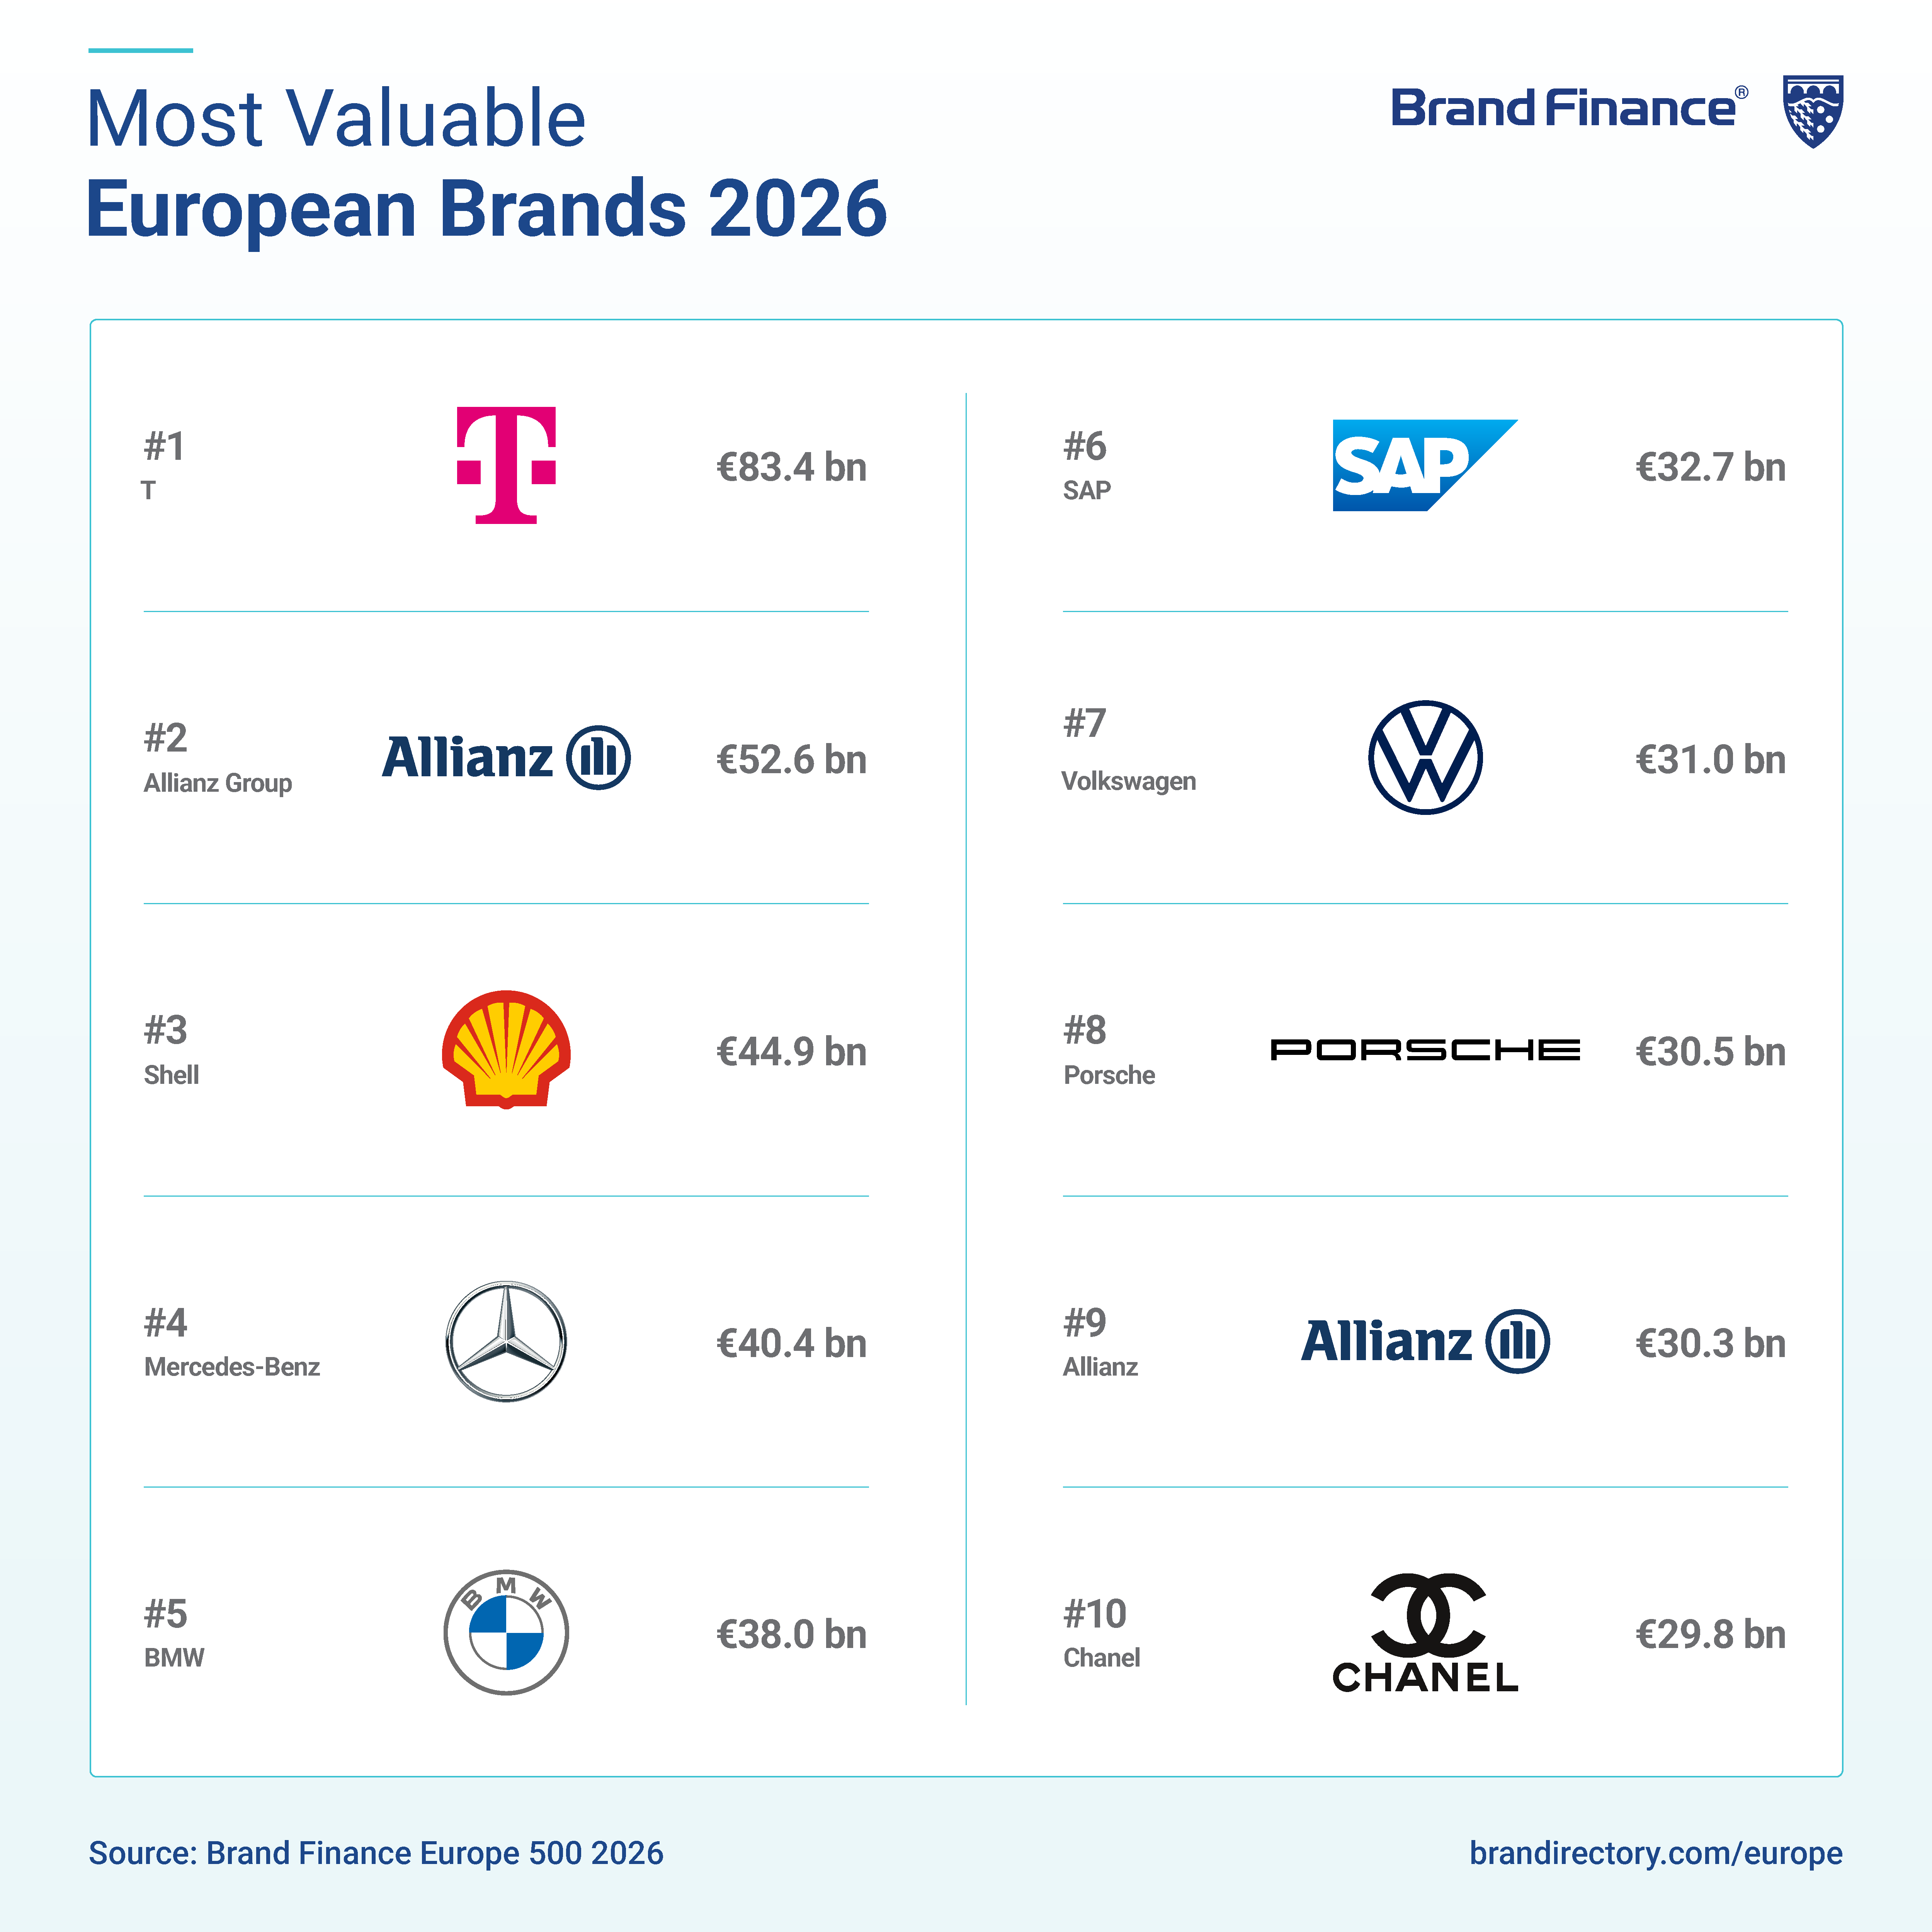
Every year, Brand Finance ranks the top 500 most valuable and strongest European brands. In 2026, T remains Europe’s most valuable brand, with brand value up 13% to USD96.2 billion, while Allianz Group (brand value up 22% to USD60.7 billion) and Shell (brand value up 14% to USD51.8 billion) have overtaken Mercedes-Benz (brand value down 12% to USD46.6 billion) to rank second and third respectively.




Brand Finance is the world’s leading brand valuation consultancy. Bridging the gap between marketing and finance, Brand Finance evaluates the strength of brands and quantifies their financial value to help organisations make strategic decisions.
Headquartered in London, Brand Finance operates in over 25 countries. Every year, Brand Finance conducts more than 6,000 brand valuations, supported by original market research, and publishes over 100 reports which rank brands across all sectors and countries.
Brand Finance also operates the Global Brand Equity Monitor, conducting original market research annually on 6,000 brands, surveying more than 175,000 respondents across 41 countries and 31 industry sectors. By combining perceptual data from the Global Brand Equity Monitor with data from its valuation database — the largest brand value database in the world — Brand Finance equips ambitious brand leaders with the data, analytics, and the strategic guidance they need to enhance brand and business value.
In addition to calculating brand value, Brand Finance also determines the relative strength of brands through a balanced scorecard of metrics, compliant with ISO 20671.
Brand Finance is a regulated accountancy firm and a committed leader in the standardisation of the brand valuation industry. Brand Finance was the first to be certified by independent auditors as compliant with both ISO 10668 and ISO 20671 and has received the official endorsement of the Marketing Accountability Standards Board (MASB) in the United States.
Brand is defined as a marketing-related intangible asset including, but not limited to, names, terms, signs, symbols, logos, and designs, intended to identify goods, services, or entities, creating distinctive images and associations in the minds of stakeholders, thereby generating economic benefits.
Brand strength is the efficacy of a brand’s performance on intangible measures relative to its competitors. Brand Finance evaluates brand strength in a process compliant with ISO 20671, looking at Marketing Investment, Stakeholder Equity, and the impact of those on Business Performance. The data used is derived from Brand Finance’s proprietary market research programme and from publicly available sources.
Each brand is assigned a Brand Strength Index (BSI) score out of 100, which feeds into the brand value calculation. Based on the score, each brand is assigned a corresponding Brand Rating up to AAA+ in a format similar to a credit rating.
Brand Finance calculates the values of brands in its rankings using the Royalty Relief approach – a brand valuation method compliant with the industry standards set in ISO 10668. It involves estimating the likely future revenues that are attributable to a brand by calculating a royalty rate that would be charged for its use, to arrive at a ‘brand value’ understood as a net economic benefit that a brand owner would achieve by licensing the brand in the open market.
The steps in this process are as follows:
1 Calculate brand strength using a balanced scorecard of metrics assessing Marketing Investment, Stakeholder Equity, and Business Performance. Brand strength is expressed as a Brand Strength Index (BSI) score on a scale of 0 to 100.
2 Determine royalty range for each industry, reflecting the importance of brand to purchasing decisions. In luxury, the maximum percentage is high, while in extractive industry, where goods are often commoditised, it is lower. This is done by reviewing comparable licensing agreements sourced from Brand Finance’s extensive database.
3 Calculate royalty rate. The BSI score is applied to the royalty range to arrive at a royalty rate. For example, if the royalty range in a sector is 0-5% and a brand has a BSI score of 80 out of 100, then an appropriate royalty rate for the use of this brand in the given sector will be 4%.
4 Determine brand-specific revenues by estimating a proportion of parent company revenues attributable to a brand.
5 Determine forecast revenues using a function of historic revenues, equity analyst forecasts, and economic growth rates.
6 Apply the royalty rate to the forecast revenues to derive brand revenues.
7 Discount post-tax brand revenues to a net present value which equals the brand value.
Brand Finance has produced this study with an independent and unbiased analysis. The values derived and opinions presented in this study are based on publicly available information and certain assumptions that Brand Finance used where such data was deficient or unclear. Brand Finance accepts no responsibility and will not be liable in the event that the publicly available information relied upon is subsequently found to be inaccurate. The opinions and financial analysis expressed in the study are not to be construed as providing investment or business advice. Brand Finance does not intend the study to be relied upon for any reason and excludes all liability to any body, government, or organisation.
The data presented in this study form part of Brand Finance's proprietary database, are provided for the benefit of the media, and are not to be used in part or in full for any commercial or technical purpose without written permission from Brand Finance.