
Finding an acceptable marketing budget to help grow the business can be one of the most challenging decisions for marketing departments and their company’s executive teams. Especially one that delivers incremental value and does not crowd out other business investment.
Our view at Brand Finance is that, given adequate analysis and evidence, it need not be so difficult. This article is designed to provide some much-needed clarity on the subject. Our goal is to provide soundness and objective rigour to discussions about budgets, within a clear understanding of return on investment.
Make marketing investments decisions using hard data. See our consulting services to find out more about what we do to help brands succeed.
1. What is Brand Equity?
Brand Equity refers to the stock of awareness and perceptions of a brand that stakeholders – in particular customers and potential customers – have, that causes them to react positively towards that brand, creating value for it into the future.
The concept has been identified for many years. Some of the most relevant academic definitions are the following:
- Srivastava and Shocker (1991) describe brand equity as "the aggregation of all accumulated attitudes and behaviour patterns in the extended minds of consumers, distribution channels and influence agents, which will enhance future profits and long term cash flow." 1
- Keller (1993) defines customer-based brand equity as "the differential effect of brand knowledge on customer response to the marketing of the brand". According to this definition, a brand is said to have positive brand equity "if consumers react more favourably to the product, price, promotion or distribution of the brand than they do to the same marketing mix element when it is attributed to a fictitiously named or unnamed version of the product or service." 2
- Farquhar (1989) suggests a relationship between high brand equity and market power asserting that: "The competitive advantage of firms that have brands with high equity includes the opportunity for successful extensions, resilience against competitors’ promotional pressures, and creation of barriers to competitive entry."3
A key objective, however, for almost all marketing teams is to build “Brand Equity” which is likely to provide benefits to the brand’s business in the long term. There is more to be said of the focus on each lever above but the focus of this paper will be specifically on Brand Communication – the most significant area of investment for most marketing departments.
2. What is the purpose of marketing investment?
There are hundreds of bestseller books from eminent professors answering this question and hundreds of thousands if not millions of marketers that could tell you the answer in their own way. I am not setting out to prove them wrong or right.
The reason I pose this question at the start of this article is to highlight that setting budgets and calculating return on marketing investment are dependent on a clear explanation of the purpose for which that investment is taking place, and the environment within which it is taking place.
As a starting point, I would offer what seems to be a reasonable, if expansive, view of the purpose of corporate marketing: to seek out markets where there is unaccessed or latent demand, build penetration in those markets, defend from competitors, and stimulate higher frequency, price and loyalty among buyers.
With the rise of employer branding, corporate brand reputation and CSR, we could also realistically add an addendum to this purpose: to generate a positive reputation and interactions among other stakeholders.The methods for satisfying this purpose can broadly be separated into the following:
Brand Communication
- Traditional, Digital and other Advertising
- Sponsorship & CSR Activities
- Public Relations, Events & Social Media
- Website & Other Content
Price and Distribution
- Pricing & Sales Promotion
- Distribution
Product
- Visual Identity & Packaging
- Product (Formulation/Service etc) & Innovation
There is also the tricky question of how much to spend on research to see whether any of this is working. The rule of thumb is that 10%-15% of the overall budget should be spent on research, although this, of course, depends on the relative price of research and the needs of the company and thus this range can differ significantly from around 1-2% up to 25% in some cases. 4
The role of a marketer is broad, and their activities vary depending on the stage of company development (start-up to established), industry, country, strategy and many other factors.
Brand Communication Channels
Within Brand Communication – which we are focussing for the remainder of this article – marketers have a series of channels into which they can invest. Typically these include:
- Traditional advertising such as TV, Radio, Out-Of-Home (OOH), Print and Cinema
- Online Advertising (including Mobile Ads and Apps)
- Website
- Search (Pay-Per-Click or Organic)
- Email & Direct Mail
- Events & Seminars

Typically, but not always, these are also complemented by these other investments:
- Public relations and earned media endorsements
- Sponsorships (including paid Celebrity Endorsements, Sports and CSR)
- Promotional content such as thought leadership content
These other investments are often promoted within the original advertising channels to maximize and amplify their effect. Each channel and additional investment have their own benefits and drawbacks and an analysis of those is part of the challenge when setting budgets. In general, however, all channels tend to work more effectively when combined into a fully integrated campaign and so most campaigns include investment in many channels.
When launching these campaigns, the specific initial media objectives would be:
- Reach: the number of different households or individuals exposed to the ads.
- Frequency: the number of times each household or individual is exposed to the ads (also known as the number of impressions).
- Continuity: the timing throughout the year of the ads.
Reach objectives may differ depending on the brand’s target audience – Coca-Cola may target all households whereas ads for Retirement Plans may be more focussed for example.
The frequency will depend principally on the type of product and the end goal of the advertising. Empirically, where the end goal is a sales response, the number of impressions differs by product type, being lower for impulse FMCG products and higher for bigger ticket purchases like kitchen appliances, insurance or B2B goods and services.
The necessary number of exposures for your product/brand will influence the number of ads necessary within a certain period and since ads will be ineffective unless you reach that level of exposure there is a serious cost to underspending as well as to overspending.
In the case of digital marketing, “Engagement” is also a key objective. Engagement refers to the number of interactions that the public has with the campaign. Additional engagement tends to increase frequency. Continuity might be influenced by consumer patterns (e.g. summer holidays tend to be planned during winter holidays, while ice cream is bought during the summer). It is also influenced by other advertiser behaviour and demand, which might influence pricing and effectiveness, and a number of other factors.
Commercial Effects of Brand Communication
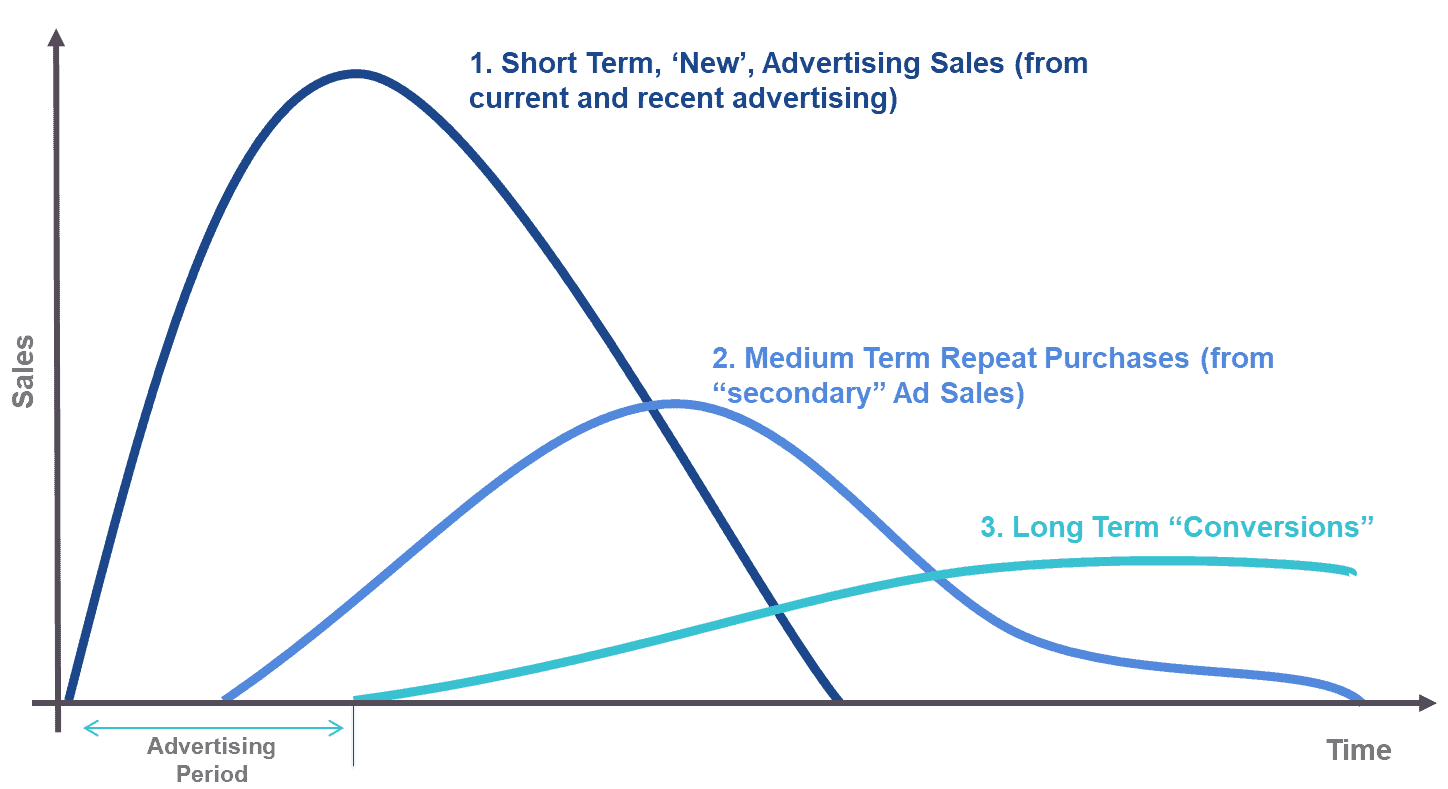
The combination of reach, frequency and continuity is overall exposure. This overall exposure, combined with the quality and relevance of the creative content, is what causes positive effects on sales. These effects can be broadly broken down in to:
- Shorter-term effects (during or shortly after the advertising)
- Medium-term effects as the immediate repeat of behaviour (habit)
- Longer-term effects on base sales volume (closely linked to the concept of brand equity)
In the “short-term”, advertising can inform customers of a product, brand or service and subsequently persuade or remind them to buy or interact with it. For most consumer goods these effects occur within the advertising period (when the ads are active). However for some products and services – especially high involvement B2C products like durables or many B2B products and services – the visible effects can happen shortly after the advertising period, with the principle step (initial intention to buy) happening within the advertising period.
In the “medium-term”, there are often further increases in sales as new purchasers from the initial sales return to purchase again. Many brands invest heavily in CRM and loyalty programmes to maximise these effects when in fact they tend to be rather small.
For example, Simon Peel, Global Media Director of Adidas, noted in his speech at the IPA’s Global Effectiveness Week 2019 that first-time buyers were actually responsible for two-thirds of sales and that the company had been over-spending on loyalty programmes on the assumption that loyalty and repeat buying would be cheap and easy to stimulate. Various recent pieces of research have, in fact, supported this assertion that loyalty programmes are less useful than market penetration 5.
In the long-term, advertising builds “conversion” of clients and long-term brand equity. Advertising and promotional activities are one of the most effective methods for building awareness and a positive reputation for a brand. Typically, therefore, advertisers seek to find a balance between Brand Building advertising and Performance (short-term, sales-focused) advertising. The oft-quoted rule of thumb is 60% brand building and 40% for performance is typically considered the best starting point. Les Binet and Peter Field in Effectiveness in Context have provided more clarity on the appropriate split by sector and product type but the range tends not to be far from 60%: 40%.
However, unfortunately for those looking for long-term value gains from advertising, very few advertisers reach 60% according to the same study by Binet and Field. Instead they focus more heavily on short-term performance advertising. An issue which has been made more difficult by digital advertising and its reporting systems’ emphasis on short-term effects like click-through, page views or immediate e-commerce sales.
That being said, despite some advertising being more specifically brand focussed, all advertising impact has an impact on awareness and brand equity. This is particularly the case if it triggers an action by a customer since those that have used a product or service tend to understand and rate said product or service more highly than those who have not.
These medium and long-term effects contribute to long-term value characteristics of advertising investment that has led to the concept of “adstock” 6, heavily used in the modelling of advertising effect.
The underlying mathematics assumes an exponential rate of decay. This is variable by category and deduced empirically from market research data on advertising awareness decay. When referring to long-term brand equity, in many cases this can be as low as 20% decay per year. The decay rate is modelled with a base level to which decay occurs which is not zero, reflecting the existence of long-term advertising effects. For strong brands, this base level can be quite high.
Together, short, medium and long-term effects combine to create long term increases in brand value and return on investment which can be measured. Long-term, it is measured using brand valuation techniques and in the short term by econometrics.
3. Where to start when setting marketing budgets?
Many companies use benchmarks to begin their discussions, a simple and reasonably effective way for agreeing on a budget. The most typical benchmarks are:
Industry Benchmarks as a Percentage of Sales
The US Small Business Administration gives advice to new companies to spend around 7-8% of revenue on marketing in order to support growth. 7 They say this might fall (to around 5-6%) as you grow in size and become “established” and might rise (to around 20%) if you are a high growth start-up.
Beyond general advice like this, there are also reported data from brands. Typically, these are: self-reported by marketing directors, reported by media owners, or reported in financial statements. There are benefits and disadvantages for each type of reporting but together can give a reasonably reliable view.
Gartner’s 2018 CMO Spend Survey, for example, finds that the average marketing budget is somewhere be around 11% to 12% of revenue. However, this number changes to around 7% for B2B brands and has strong fluctuations between sector. Brand Finance research also finds similar swings between sectors as follows:
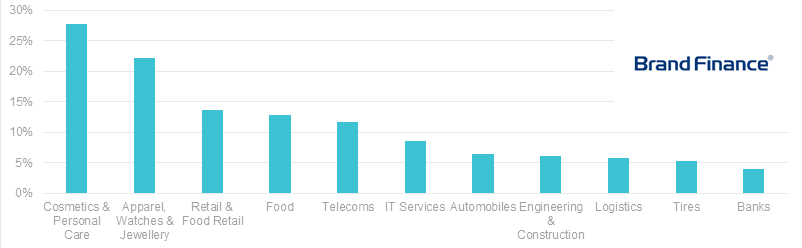
There are, however, various issues with these sorts of benchmarks. Firstly, it assumes that what your competitors are doing is correct which is certainly not always the case. Secondly, it assumes that all companies are recording their costs in similar ways which is certainly not always the case.
Finally, budgets strongly depend on your circumstances – even if the benchmark is based on industry competitors only. Your specific stage of business development, available media, business strategy, brand strength are all likely to influence what you really should be spending where and cannot be captured in industry-wide benchmarks.
Uber, the ride-hailing app, spent 32.6% of their revenue on sales and marketing in 2019. According to the benchmark they spent too much, but were they really wrong to do so?
’Share of Voice’ refers to the relative share of media exposure that one brand has in comparison to its competitors. There have been many studies on ’Share of Voice’ models that show that for every share of market there is a corresponding ’Share of Voice’. That is if you invest a certain amount in ’Share of Voice’ you should be fairly sure of your market share.
These share percentages tend to be equivalent (i.e. a 1:1 relationship). However, there are some economies of scale benefits to being a larger brand, which tends to be the ability to underspend a little relative to size 8.
Therefore, if your goal is to maintain share then your ’Share of Voice’, and therefore spend, should be kept at a level that corresponds with your share of market – otherwise known as “equilibrium level of share of voice”. If your goal is to grow share, your SOV should be above the equivalent for share of market, giving you what is referred to as “Extra Share of Voice” (ESOV).
From month to month and quarter to quarter, your own ’Share of Voice’ tends to change significantly as campaigns compete for time and space with the competition. Despite this temporary difference in marketing spend, the intertemporal effects of ad spend continue. This creates the need to conduct AdStock (or AWA) modelling as a means to identify the effective ’Share of Voice’ as the basis for setting new budgets.
As a result of the fact that effective share of voice takes time to build up (due to AdStock), and that large brands have efficiencies of scale on their equilibrium shares of voice, there can be significant negative effects of cutting budgets below maintenance levels. This should not be done without careful consideration. Even in the case of severe recessions, we have found maintaining ’Share of Voice’ (or even increasing it) can be very value-generative as advertising gets cheaper and customers delay rather than cancel purchases.
’Share of Voice’ AdStock models are a very effective benchmark to use for setting overall budgets. However, data on ’Share of Voice’ can at times be difficult to find particularly when your brand is in a market of competitors that do not have identical products, therefore making it difficult to identify the “market” from which to analyse share. This difficulty with data is, in fact, becoming worse as a result of the current unreliability of the measure with digital spend – although there are ongoing steps to improve this.
Industry Marketing Split % Benchmarks
Usually media channel split is less easy to find than overall sales % benchmarks but they exist. Marketingcharts.com, for example, published a study on the supposed “Best Allocation” of media according to 300 advertisers, agencies and media companies which highlighted that Traditional Advertising, for example, should be the largest allocation with around 16% of total spend. Gartner in its CMO Spend Study tracks what CMOs say they actually spend (as opposed to what they think they should).
Such studies are useful for highlighting glaring errors in marketing spend allocation. For example, when advising a major engineering-led technology company recently, we found that over 50% of their marketing budget was spent on events. We used this benchmark to highlight that the typical allocation for events is around 1/10th of that amount (5%), creating an impetus to rethink marketing budget.
However, as with any benchmarks set with comparables, this suffers from the fact that not all brands’ needs are equal and behind these benchmarks lies a lot of variation.
Customer Expectation Benchmarks
Marketing budgets can also be set simply by reviewing market research on where customers receive their information about new products in the category or where they expect to find that information. For example, video gamers may be more avid readers of technology magazines and games review websites which would help suggest an over-indexing on those channels.
These benchmarks can be helpful but, in general, suffer from being highly imprecise.
Company Historic Benchmarks
Many budgets are set by reviewing those for the previous year, deciding whether the result was reasonably good, doing the same again if so or tweaking some of the totals and allocations if not. If management is generally happy with the previous year’s activities, this can be and often is enough a basis for the current year budget.
Without detailed analysis, however, it is difficult to diagnose issues and disentangle the effects of different types of marketing investments from others. This can cause inefficient spend to become entrenched in an organization and difficult to stop. In fact, this type of benchmark is what caused the technology company to keep spending 50%+ on events every year despite the strangeness of the allocation in relation to returns.
Objectives/Tasks Benchmarks
This approach starts by identifying all activities that a marketing department wants to do in a given year, adding up their costs and setting a budget based on that. There are some fairly clear issues with this approach – in particular, a lack of focus on outputs and significant amounts of trust put into the subjective assessment of what is necessary.
However, in some specific cases, this approach can be useful and in fact necessary. In the case of a rebrand we advised on, it became clear that to drive awareness and brand equity up to a level equivalent with the brand that was being replaced approximately €4m extra investment was needed per year in the media budget. A marketing budget based on the average company would not have taken this need into account and the business would have lost significant market share.
In summary
Benchmarks like these are all useful starting points for setting budgets and marketing teams should incorporate them into the decision-making process.
They do, however, tend to lack an element of specificity and – other than for SOV benchmarks – they also lack a basis in return on investment analysis.
It is therefore strongly recommended that these approaches are complemented by return on investment analyses of some kind as an analytical basis to finetune marketing budgets.
References
- Srivastava, R., and Shocker, A. (1991). Brand equity: A perspective on its meaning and measurement. MSI Report 91-124. Cambridge, MA: Marketing Science Institute.↩
- Keller, K. L. (1993) ‘Conceptualizing, Measuring, and Managing Customer-Based Brand Equity’, Journal of Marketing, 57(1), pp. 1–22. doi: 10.1177/002224299305700101↩
- Farquhar, P.H. (1989) Managing Brand Equity. Marketing Research, 1, 24-33.↩
- https://instituteforpr.org/how-much-of-the-budget-should-be-spent-on-research-and-insights-an-ipr-measurement-commission-roundtable/↩
- Binet, L. & Field, P. (2018) “Effectiveness in Context” EffWorks, Institute of Practitioners in Advertising↩
- Broadbent, S. & Fry, T. (1995) “Adstock modelling for the longer term”, Journal of the Market Research Society (October), 385-403, and earlier papers↩
- https://www.sba.gov/taxonomy/term/15051?page=37↩
- Jones, J.P. (1990) “Ad Spending: maintaining market share”, Harvard Business Review, 68, 1 (January/February↩