
As important as it to know Where to Start When Setting Marketing Budgets, it is just as important, if not more, to measure the return on your marketing investment.
Make marketing investments decisions using hard data. See our consulting services to find out more about what we do to help brands succeed.
What is Return on Marketing Investment (ROMI)?
Return on Marketing Investment is a method to determine the financial value attributable to a specific set of marketing initiatives (net of marketing spending), divided by the marketing ‘invested’ or risked for that set of initiatives.
It is widely used in some form in many companies since it: provides an additional level of control and prediction of future cash flows; helps to improve marketing effectiveness and; provides a formulaic approach to marketing accountability that helps to build trust and understanding with finance departments.
The simplest way of explaining Return on Marketing Investment (ROMI) mathematically is as follows: ROMI is the incremental financial contribution generated by marketing over marketing spend.

There are many benefits of measuring Return on Marketing Investment including:
- Assessing historical and projected marketing productivity.
- Reviewing and approving marketing budgets.
- Allocating limited marketing funds among competing brands, products, markets, customers, marketing mix elements and media.
- Evaluating specific marketing campaigns for go/no-go decisions.
The measure is widely used, with around 77% of a sample of 194 North American marketing leaders saying they consider it very useful and 49% saying it was “useful in managing and monitoring their business”. 1
According to Gartner’s 2018 CMO Survey, ROI was the 6th most picked option for the question “Considering all of the metrics being tracked on your CMO (or senior marketing leadership) dashboard, which are most important to inform marketing strategy?”. This was closely behind Awareness, Share of Wallet, Competitive Benchmarks, Brand Health and Share of Voice – all of which are regular inputs to ROI analyses. 2
However, it is not as popular as it could or potentially should be mostly as a result of its broad scope as well as some complexities and confusion when identifying and justifying what is the “financial contribution generated by marketing”.
This is partly because return can be identified in multiple different ways:
- Total: return on all spending. This return is most important as a justification for total budgets and defence against major cuts.
- Incremental: return on a specified additional spending increment. This is most useful for analysing a go/no-go decision for a new
marketing campaign or activity.
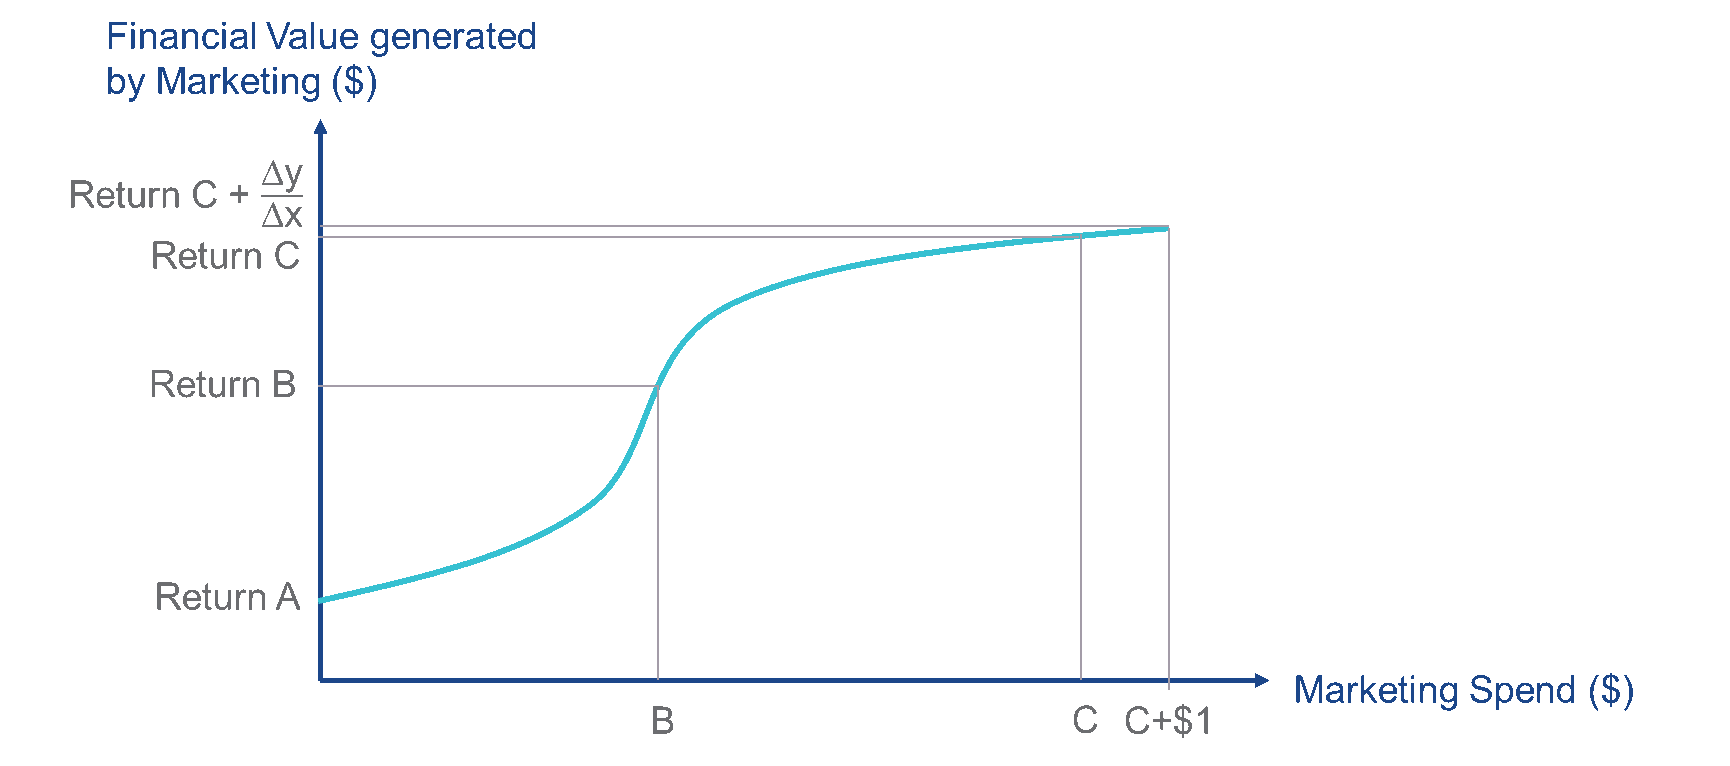
- Marginal: estimated return on the ‘last dollar’ of marketing spend. This is an important range to consider profit maximisation (in particular marketing mix considerations) and therefore ROMI maximisation.
The analysis can also be performed on marketing spend within a spectrum of scope between:
- Campaign or Channel Specific: ROI measures for a specific search advertisement, an e-mail campaign, or the specific offer within a direct mail campaign.
- Full mix: ROI measures for the full marketing mix, or integrated marketing activities which may even include multi-year costs for market research, logo design and revisions, cooperative advertising rebates and all media.
This complexity and confusion may also have been encouraged by the rise of digital media since online “ROI” measures often fail to understand the counterfactual (i.e. what would happen without the investment).
Simon Peel, Global Media Director of Adidas, identified in his speech to the IPA’s Global Effectiveness Week 2019 that Adidas had lost some trust in ROI as a leading measure since ROI for Pay-Per-Click (PPC) advertising was exaggerating the benefit that PPC was creating. The measure, for example, calculated a click-through from a paid search result from the term “Adidas” was being recorded as a return on that campaign despite the fact it is almost certain that click through would have happened organically, without any paid search.
How do you measure the “financial contribution generated by marketing”?
There are three approaches widely considered to be appropriate for an analysis of the financial contribution of marketing:
- Comparative Cost
- Short-Term Profit Lift
1. Comparative Cost
This approach refers to the costs saved created by shifting from one medium to another medium while maintaining the same output. Take an example of a company spending $1m in cinema advertising, with a reach of 20% of the market, and an average frequency of two ad views per person. If this company were to turn off all advertising in cinemas and switch to radio, retaining the same reach and frequency while paying only $500k, there would have been a $500k saving.
Depending on the way you calculate it, this could indicate a return of 50%($500k saving/ $1m original cost) or 100% ($500k saving / $500k current cost). This method can be useful as part of the discussion of the marketing mix but costs are often not neatly comparable between media types and it is often difficult to reliably identify whether outputs are the same or similar given different types of reporting and outcomes. In any case, the approach is not focused on the benefit of the marketing and therefore does not truly identify the return.
2. Short-Term Profit Lift
These approaches are based on the analysis of the short-term returns from marketing investment. This analysis is sometimes direct modelling of the effects of marketing on sales. This, when combined with the profit margin of incremental revenue, will provide the return.
In this case sales data are the dependent variables from the modelling. Where this is not possible, analysis is completed against a data point with a known relationship to sales – for example, website views, click-throughs or footfall. In some cases – for example, B2B brands – this modelling is better applied to acquisition and churn of customers, linking to individual customer value. This, in turn, gives a longer-term view of value – bearing in mind the more relationship focussed nature of these types of businesses.
At all times, the best tool to complete this analysis is econometrics – the use of statistical methods to explain the empirical relationships between sets of data. In the case of marketing budget setting, these statistical techniques are often summarised as “Marketing Mix Modelling”.
Marketing Mix Modelling
Marketing Mix Modelling uses econometric analysis to attribute past sales movements to the contributions coming from changes in differing causal drivers.
The attribution process is like weighing many different combinations of ingredients in a cake recipe to work out by implication what impact each ingredient has on the taste, texture and appearance of the cake – and what improvements (or synergies) there may be when ingredients are used together.

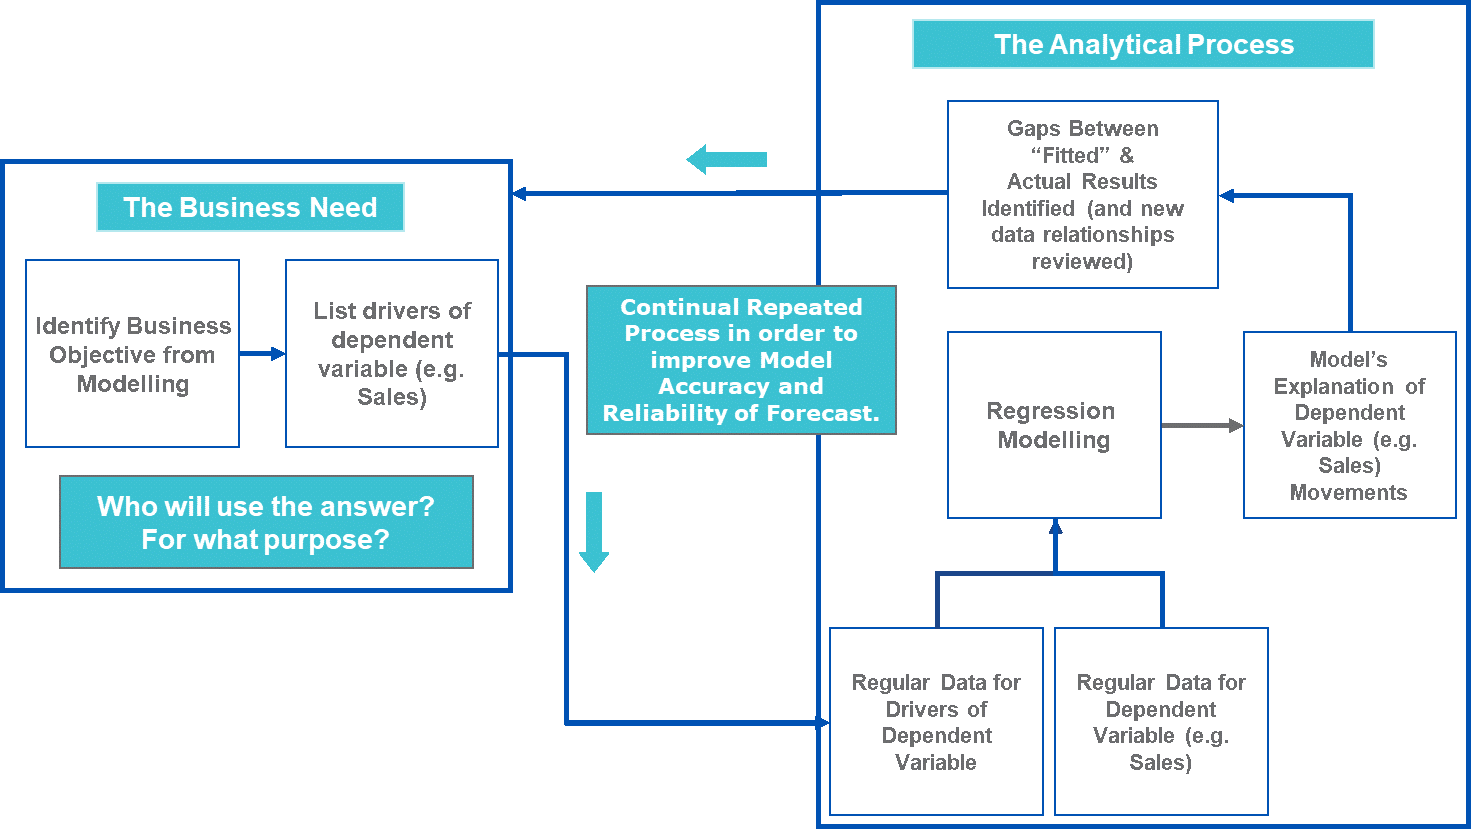
The result of the modelling is that we determine what the marketing mix needs to be to get the highest sales uplift or, to extend the metaphor, what is the best recipe to use to bake our cake. In order to conduct this type of model, there are typically 6 steps
- Define the objective of the model (the predicted dependent variable)
- Identify potential sales drivers (or drivers of other dependent variables)
- Identify sources for, collect and “clean” relevant data
- Build the modelling database
- Conduct initial modelling
- Iteratively refine both data and modelling to get the best model
An example list of independent variables for a Marketing Mix Model for a durable goods brand might include non-marketing spend related drivers such as:
- Average Item Price
- Price Promotions
- Product Mix
- Width & Depth of Range
- Economic Conditions
- Seasonality
- Competitive Spend/Activity
But importantly must include marketing activities segmented at the level at which you intend to use the model to segment spend.
Long Term Brand Equity
These variables are identified after a detailed review of the business and its environment to develop reasonable expectations of drivers of sales. This process is made easier with experience.
The data for the variables (independent and dependent) need to have been tracked for some time (preferably 2 to 3 years or more) and with some regularity (preferably weekly but no less than quarterly), in order to create reliability and accuracy of the models. The need for this level of data repetition can indeed be a challenge for many brands.
The sources of data are varied but can be media agency investment data, economic forecasters, internal documents, original (or syndicated) market research and many other different sources. The data should be cleaned so that they respond to the same time periods and are stored in equivalent databases.
A correlation analysis will then be completed to identify multi-collinearity between the data and remove any independent variables that are already explained by other variables in the model.
This is done because variables that are already explained by other variables skew the model, making some attributes seem more or less important than they really are. Modelling of the data using regression analysis follows this data set-up.
Usually, this involves multiple models to test different types of relationships. Sometimes the relationships will be linear (i.e. as one increases, sales increases at a similar amount) but in many cases, this will not be the case. For example, advertising spend tends to reach a point of saturation and diminishes in its effectiveness making it non-linear.
Subsequently, measurement of statistical fit is necessary as well as significance testing of each indicator is necessary to build a robust model. Similarly, common sense checks are also essential such as that higher price reduces volume. As these checks are made and issues identified, the model should be updated and re-calculated.
Reporting of marketing mix modelling usually includes an explanation of the sources of sales volume over time as this simplified model below shows:
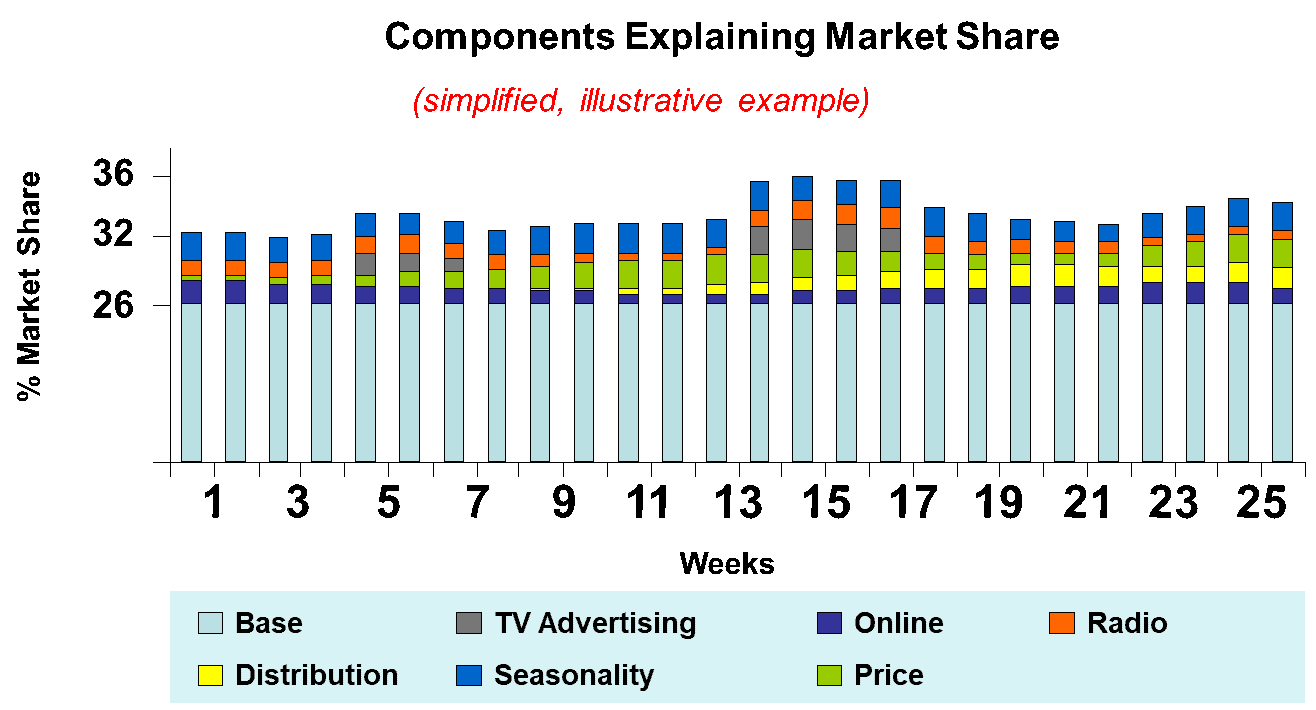
By understanding the contribution of each channel and its individual relationship with sales, marketers can therefore use the model as a predictive tool to compare different marketing plans in order to maximize profit and (therefore) return on marketing investment.
However, within these models, a large part of volume is explained as “base” sales.
This refers to the sales volume generated by long-term brand equity impacts as well other long-term sources of value. In the graph above, “base” sales is constant. In reality, this figure gradually changes as the dynamics of the market (e.g. a shift online by some brands), the brands’ relative strengths or some other relevant predictive variable change.
In order to understand where this value comes from and how to maximise it, a different type of analysis is needed, analyzing long-term brand equity and financial data via advanced research techniques – Conjoint and Brand Drivers Analysis.
Long-term Brand Valuation Analysis (Brand Impact Analysis)
Long-term brand equity is one of the most important drivers of business value, making up an average of 20% of business profitability and value. Understanding how it influences long term business value drivers is essential for good brand management and business planning and its many concrete applications can include:
- Marketing Investment, Content and Creative Planning
- Brand Architecture Assessments
- Brand Positioning and Purpose Refinements
- Brand Licencing Negotiations and Extension Decisions
- Brand Transition Management
In order to identify the commercial value of long-term brand equity, it is necessary to link it to commercial impact. To do this, market research methods are employed to identify how strongly a brand influences choice relative to a conceptual unbranded equivalent (sometimes referred to as a generic or floor brand within the category) in a process known as “Brand Impact Analysis”.
This process is then used to isolate the revenues and profits attributable to the incremental effect of a brand versus the effect that would be achieved if there were no brand to identify the contribution of a brand to the value generated by a branded product or service. This isolation process is either conducted using Conjoint Research or Drivers Analysis
" A robust measure of brand equity is strategically crucial for any branded business. It may sometimes be difficult to quantify and there is no 100% consensus on how to measure it, but every business needs to develop a system for addressing whether their brands are healthy, enjoy a strong resilient reputation, and most importantly, are poised to deliver future growth and commercial return."
Steven Thompson, Insight Director, Brand Finance
Conjoint Research
Conjoint research seeks to link specific perceptual brand attributes held by customers or potential customers to changes in their brand preference and brand choice, by estimating the underlying ‘utility’ customers ascribe to different ‘levels’ of a brand attribute. Research respondents are presented with a series of choices between alternative propositions or products. A balanced experimental design is used to ensure equal representation of different combinations of product features.
The result identifies the different utilities of discrete product/service choices and therefore the incremental increase in the choice that the brand brings to purchase decisions.
This, in turn, can be expressed in terms of either a price effect, a volume effect or a combination of the two. These are used to calculate revenues or “Base Sales” in the volumetric graph of sales drivers in the section above.
Drivers Analysis
This involves analysing data from existing (or specially conducted) brand tracking studies to understand the links between individual attributes, broader factors or groupings of attributes and brand equity (i.e. preference).
Typically, individual attributes are categorized into groups either through statistical analysis (e.g. factor analysis) or logical grouping. This data reduction exercise seeks to eliminate redundancy between the main factors such that instead of having a large number of attributes describing similar or near-identical aspects of the brand, the data set is reduced down to a smaller number of statistically independent factors.
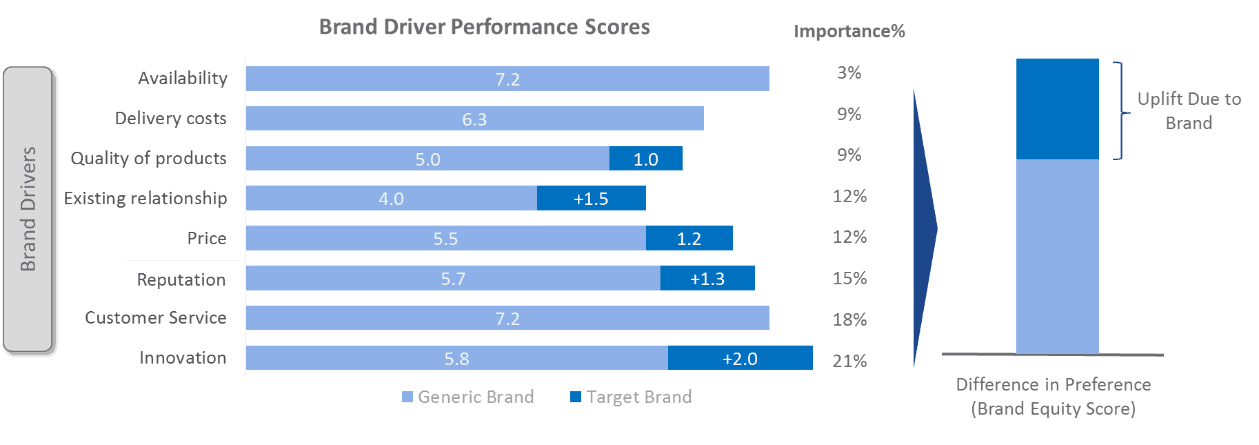
Using the research data each subject brand is scored for its performance on each of the key Brand Equity drivers. This research also generates a brand preference score, which is typically used as a proxy for brand equity.
Once these attributes or factors have been identified, regression analysis is applied to the research data to statistically identify the importance weighting of each Brand Equity driver in driving brand preference. This is preferred to “stated” importance weightings which are overly-rational.
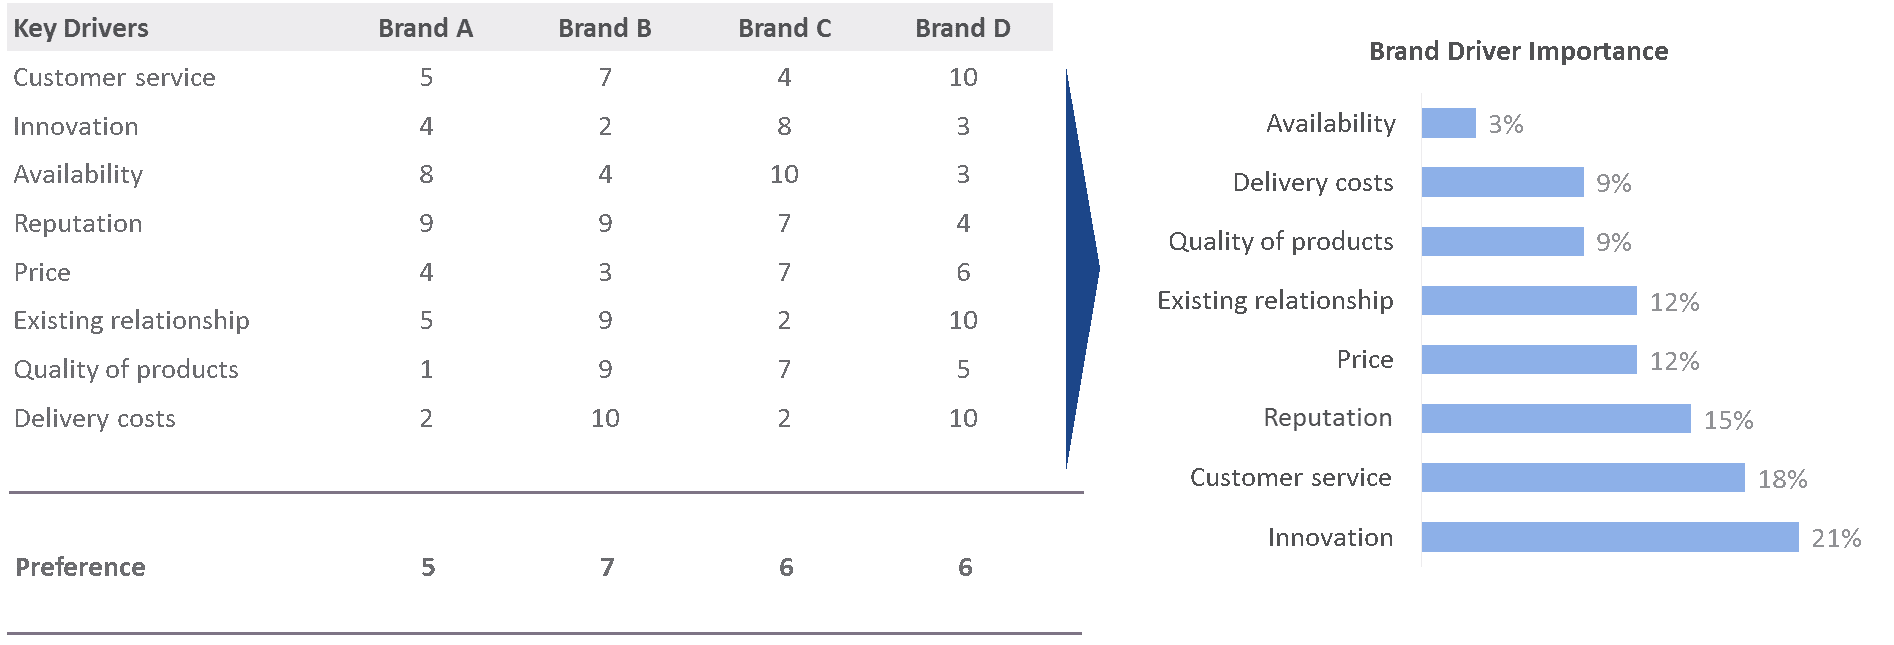
Subsequently, the difference in brand driver performance between target brand vs generic brand is analysed to highlight the impact on preference. The generic brand can either be chosen from the market or constructed hypothetically by setting scores on brand relevant attributes to the level of lowest brand score observed on an attribute by attribute basis.
Having arrived at a Brand Equity score, the next step is to identify its impacts on choice. this can be done subject to good market share data availability, by comparing the Brand Equity score with volume market share for all brands in the market and undertaking regression analysis. This is then combined into the company’s income statement to identify the impact on revenue, profitability and cash flow.
Use of Brand Impact Analysis
By analysing the differences in brand utilities/preference and their impact
on financial performance, these types of analyses can subsequently be used to understand:
- What is the overall benefit of brand building to the company?
- What elements of brand strength and equity are causing base demand?
The answer to this first question enables marketers to justify budgets more successfully, particularly when there is an issue of short-termism in marketing decision-making.
The answer to the second question helps to refine brand positioning, messaging, creative and content to make marketing more effective. When combined with marketing mix modelling that uses brand equity measures as dependent variables, you can also even identify what best channel mix to optimise long-term performance.
What does this mean for marketing teams and their businesses?
We advise clients to set budgets in the way that suits them. What suits them depends on Data availability; Management Scepticism or Support; Sophistication and Scale of Investment. At the start of any assignment we therefore suggest a Data, Management, Sophistication (DMS) Audit.
Data Availability Assessment
1. Keep good records of marketing spend data, split by channel and segment.
2. Identify and track benchmarks – including from Brand Finance’s and other third party databases – of competitors spend and compare against your own.
3. Conduct a structured review of all the factors driving sales (including Brand Equity).
4. Assess availability of Share of Voice data in the relative marketing channels (or any available proxy measures).
5. Track Brand Health measures in order to track long-term brand value – or use syndicated research like Brand Finance’s Global Brand Equity Monitor.
This step identifies what level of analysis or approach is possible and sets the business up for more advanced techniques later.
Management Scepticism and Support (Workshops and Interviews)
6. Identify all of the different stakeholders involved in marketing investment decisions, their level of involvement and knowledge and their views on total and split of spend.
7. Review historic company budget split benchmarks in comparison with industry benchmarks to identify anomalies that arise as a result of disjointed management.
8. Review marketing objectives of management and prepare a budget based on those objectives to compare with other benchmarks.
9. Provide some basic training to those that need it. This tends to be particularly necessary on the subject of long versus short-term effects
of marketing.
10. This step identifies what level of analysis will be necessary to convince all relevant parties involved in decision-making.10. Review size and importance of marketing budget in comparison with other major company investments and the cost of detailed modelling or analysis.
Sophistication and Scale Analysis
11. Analyse the level of investment of competitors and their share of voice relative to your own in order to see if you are ahead or should be catching up.
12. Calculate the average value of brands in your industry relative to company value (and your own brand’s value) to see what value could be gained from better marketing. This step identifies how much return you could be leaving on the table as a result of a less sophisticated approach to marketing spend analysis.
Together these steps help to define whether you stick with only using benchmarks to set budgets or you introduce more advanced techniques in order to squeeze as much value as possible from the investment.
Conclusion
It is important to conduct some form of Return on Investment analysis – Whether this is simple maths with sensible assumptions or more advanced statistical techniques, some way to understand financial performance is essential.
This will help to make sure that you are investing sufficiently and in the correct channels in order to defend from competitors, support new products and services, maintain market share and build brand equity all the while not wasting budget that could be better used elsewhere.
The results of this process will likely be different at every cycle so it should be conducted each time a budget needs to be approved. In the case where more advanced analysis is not conducted, data should be prepared in order to give the opportunity to do so in the future. Where an analysis approach is being conducted this process is necessary to identify improvements and updates to the model to modernise and improve them with new facts from the market and management.
The budget process is one of the most important tasks for marketing teams and it deserves to be done with careful planning. John Wanamaker’s famous phrase was that half of his advertising investment is wasted; he just doesn’t know which half. This issue needs no longer cause marketers sleepless nights. The tools are available, it is just time for all marketers to use them.
- Farris, P. W., Bendle, N. T., Pfeifer, P. E. and Reibstein, D. J. (2010) ‘Marketing Metrics: The Definitive Guide to Measuring Marketing Performance’, 2nd edn, Pearson Education, Upper Saddle River, NJ[↩]
- https://www.gartner.com/en/marketing/research/cmo-spend-survey-free-research-2018-2019[↩]