
Brand Finance’s data estimates 83% of global intangible asset value is not disclosed on balance sheets
BEIJING, 13 November 2025 – In 2025, the value of intangible assets owned by the world’s largest companies has reached USD97.6 trillion, according to a new report from Brand Finance, the world's leading brand valuation consultancy. This represents a 23% increase from 2024, now reaching its highest level since Brand Finance began tracking it in 1996.
The Brand Finance methodology relies on the enterprise value of firms to determine implied intangible asset value because most intangible asset value is not reported by the owner companies. This lack of reporting is why 83% of estimated total global intangible asset value is unaccounted for in company financial reports.
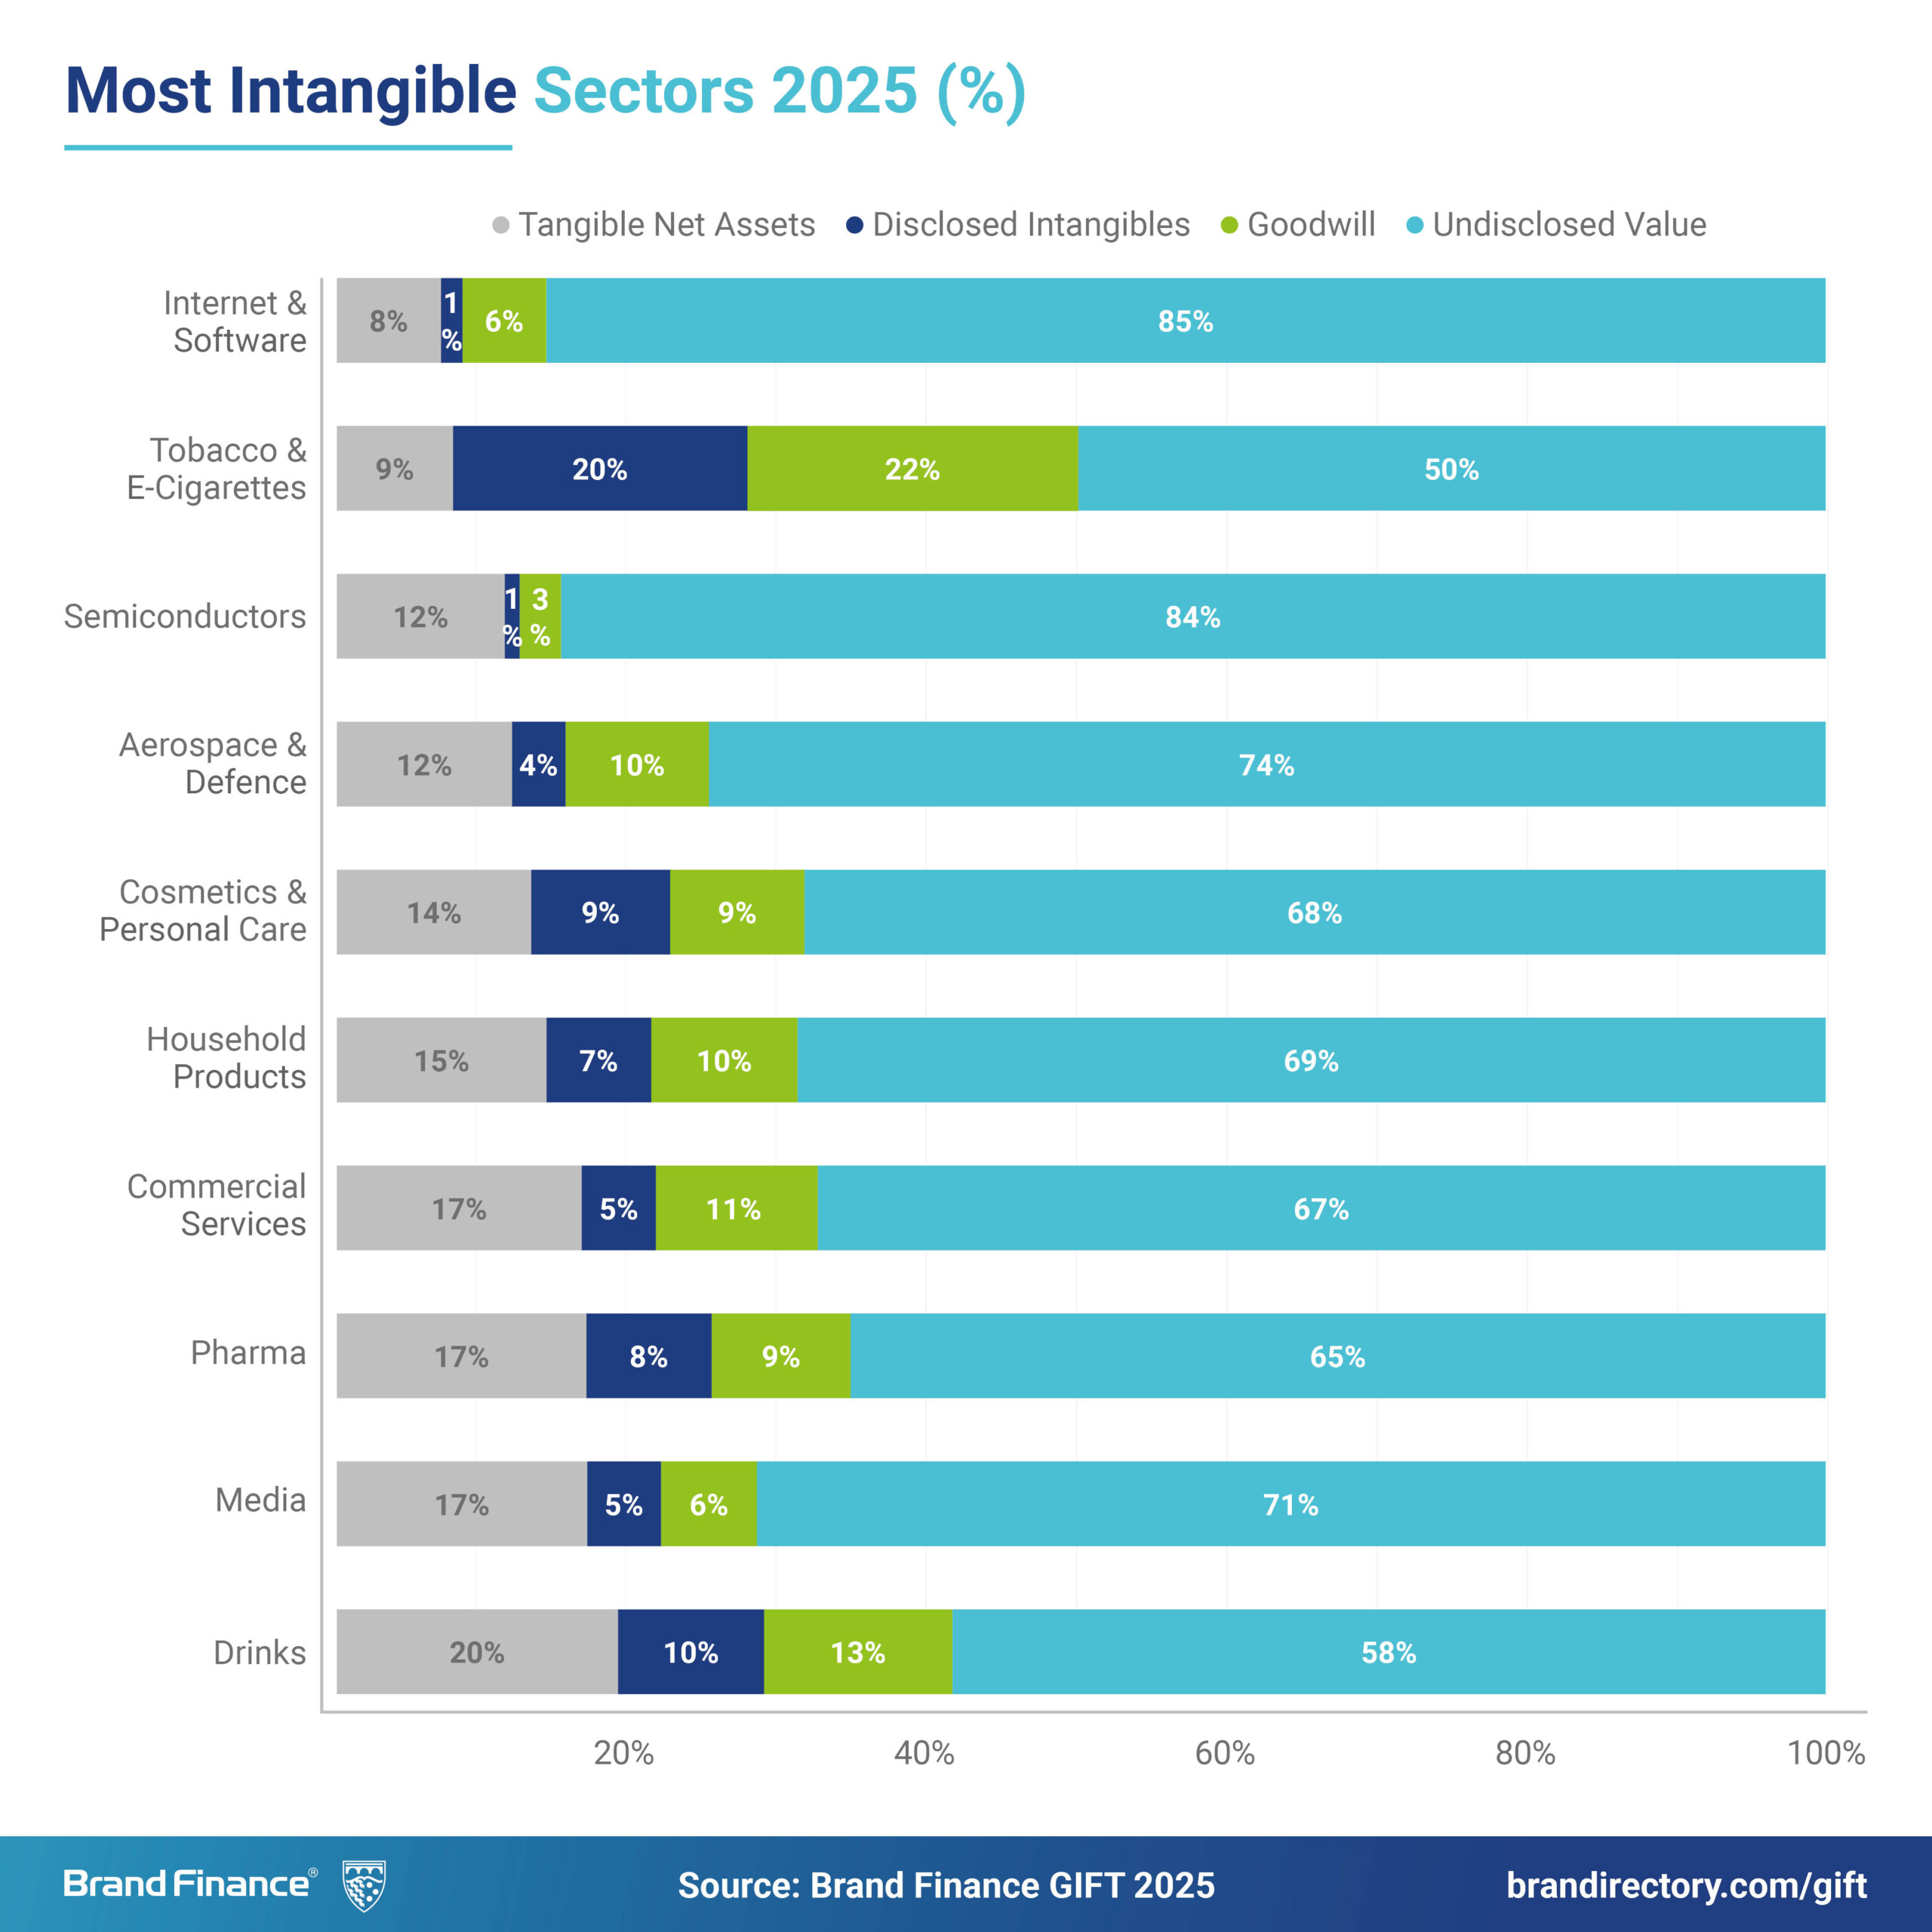
Every year, the Brand Finance Global Intangible Finance Tracker (GIFT™) report tracks the value of the world’s largest companies by intangible asset value. Intangible assets are identifiable, non-monetary assets without physical substance. Intangible assets can be grouped into three broad categories: rights (including leases, agreements, contracts), relationships (including a trained workforce), and intellectual property (including brands, patents, copyrights).
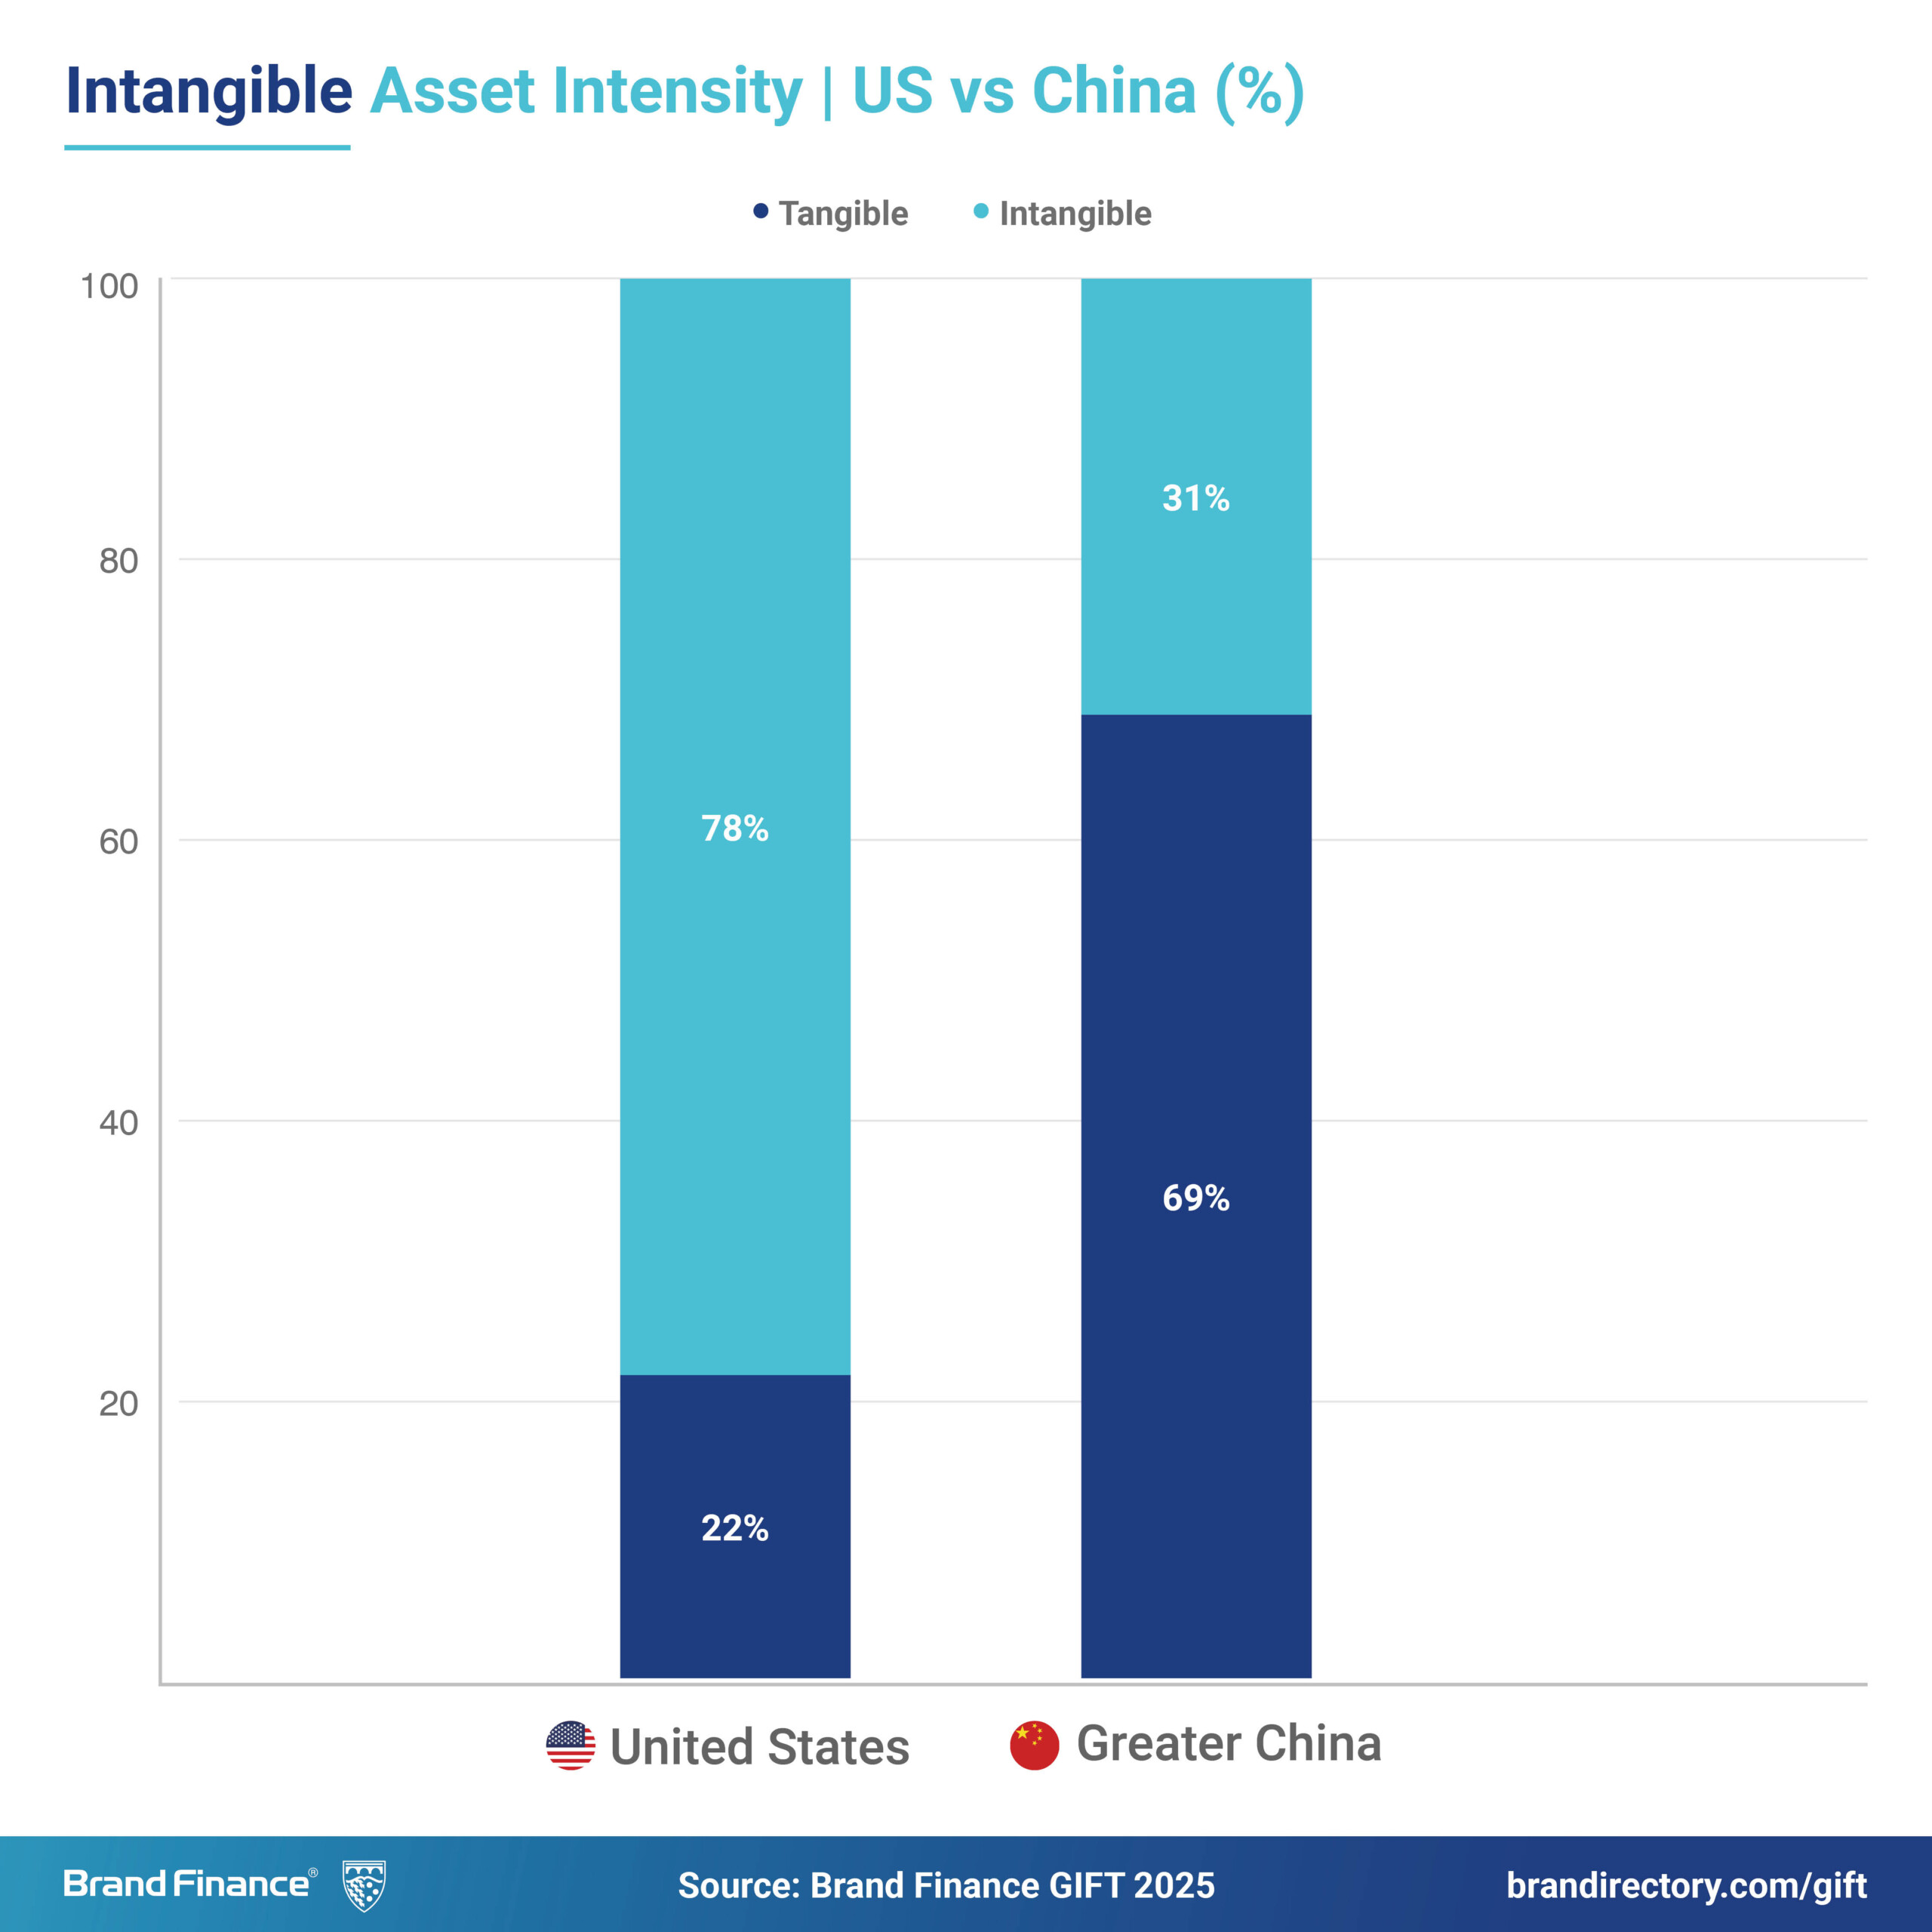
Brand Finance’s research data shows China’s intangible asset value has grown from 15% in 2024 to 31% in 2025. Even so, the country remains predominantly tangible in comparison to others in the region. Historically, China’s economy has been largely rooted in mining and manufacturing – industries that are capital-intensive and rely heavily on assets. However, the recent expansion of its technology sector is gradually shifting the country towards having more intangible assets.
The insurance sector has been a major driver of China’s intangible growth, recording the largest absolute gains worldwide with China Life Insurance doubling in intangible value, rising 129% since 2024. At the top of the China ranking, Taiwan Semiconductor Manufacturing Company (TSMC) remains the most intangible company with USD789 billion in value, up 27% in 2025, followed by Tencent Holdings and Kweichow Moutai Co., both rising by 56% and 8%, respectively, since 2024.
The largest total intangible value in China is attributed to the semiconductor sector which had an increase of 49% since 2024. This is followed by the technology & IT sector in second place and the engineering & construction sector in third. Both these sectors saw a notable leap in intangibility. While the technology & IT sector’s intangible asset value rose by 98%, the engineering & construction sector increased its intangible value by 150%. The increase in the technology & IT sector can be attributed to Xiaomi Corporation, which had the largest growth in intangible asset value among the top 100 global brands, rising by 529% to USD140 billion since 2024.
Scott Chen, Managing Director China, Brand Finance, commented:
“Despite being a predominantly tangible market, China is experiencing the effects of a shifting economy, seen in the rise of its intangible asset value from 15% in 2024 to 31% in 2025. This reflects a deviation towards knowledge-driven sectors such as technology & IT and semiconductors, which account for 35% of the nation’s share of intangible assets. A shift of this magnitude highlights China’s technological advancement and growth to become a global force of innovation.”
On a global level, the U.S. has overtaken Denmark to become the most intangible market in the world. The total intangible value of the U.S. market stands at 78%, while Denmark’s intangibility has dropped from 82% in 2024 to 67% in 2025.
Data from Brand Finance reveals that NVIDIA is the company with the highest intangible value globally, increasing 50% to USD4.3 trillion. Moreover, eight of the world’s top 10 companies with the highest intangible value are based in the U.S., with Microsoft, Apple, Amazon, Alphabet ranked second through fifth for intangible value and as key contributors to the country’s high intangible value.

Brand Finance is the world’s leading brand valuation consultancy. Bridging the gap between marketing and finance, Brand Finance evaluates the strength of brands and quantifies their financial value to help organisations make strategic decisions.
Headquartered in London, Brand Finance operates in over 25 countries. Every year, Brand Finance conducts more than 6,000 brand valuations, supported by original market research, and publishes over 100 reports which rank brands across all sectors and countries.
Brand Finance also operates the Global Brand Equity Monitor, conducting original market research annually on 6,000 brands, surveying more than 175,000 respondents across 41 countries and 31 industry sectors. By combining perceptual data from the Global Brand Equity Monitor with data from its valuation database — the largest brand value database in the world — Brand Finance equips ambitious brand leaders with the data, analytics, and the strategic guidance they need to enhance brand and business value.
In addition to calculating brand value, Brand Finance also determines the relative strength of brands through a balanced scorecard of metrics, compliant with ISO 20671.
Brand Finance is a regulated accountancy firm and a committed leader in the standardisation of the brand valuation industry. Brand Finance was the first to be certified by independent auditors as compliant with both ISO 10668 and ISO 20671 and has received the official endorsement of the Marketing Accountability Standards Board (MASB) in the United States.
Brand is defined as a marketing-related intangible asset including, but not limited to, names, terms, signs, symbols, logos, and designs, intended to identify goods, services, or entities, creating distinctive images and associations in the minds of stakeholders, thereby generating economic benefits.
Brand strength is the efficacy of a brand’s performance on intangible measures relative to its competitors. Brand Finance evaluates brand strength in a process compliant with ISO 20671, looking at Marketing Investment, Stakeholder Equity, and the impact of those on Business Performance. The data used is derived from Brand Finance’s proprietary market research programme and from publicly available sources.
Each brand is assigned a Brand Strength Index (BSI) score out of 100, which feeds into the brand value calculation. Based on the score, each brand is assigned a corresponding Brand Rating up to AAA+ in a format similar to a credit rating.
Brand Finance calculates the values of brands in its rankings using the Royalty Relief approach – a brand valuation method compliant with the industry standards set in ISO 10668. It involves estimating the likely future revenues that are attributable to a brand by calculating a royalty rate that would be charged for its use, to arrive at a ‘brand value’ understood as a net economic benefit that a brand owner would achieve by licensing the brand in the open market.
The steps in this process are as follows:
1 Calculate brand strength using a balanced scorecard of metrics assessing Marketing Investment, Stakeholder Equity, and Business Performance. Brand strength is expressed as a Brand Strength Index (BSI) score on a scale of 0 to 100.
2 Determine royalty range for each industry, reflecting the importance of brand to purchasing decisions. In luxury, the maximum percentage is high, while in extractive industry, where goods are often commoditised, it is lower. This is done by reviewing comparable licensing agreements sourced from Brand Finance’s extensive database.
3 Calculate royalty rate. The BSI score is applied to the royalty range to arrive at a royalty rate. For example, if the royalty range in a sector is 0-5% and a brand has a BSI score of 80 out of 100, then an appropriate royalty rate for the use of this brand in the given sector will be 4%.
4 Determine brand-specific revenues by estimating a proportion of parent company revenues attributable to a brand.
5 Determine forecast revenues using a function of historic revenues, equity analyst forecasts, and economic growth rates.
6 Apply the royalty rate to the forecast revenues to derive brand revenues.
7 Discount post-tax brand revenues to a net present value which equals the brand value.
Brand Finance has produced this study with an independent and unbiased analysis. The values derived and opinions presented in this study are based on publicly available information and certain assumptions that Brand Finance used where such data was deficient or unclear. Brand Finance accepts no responsibility and will not be liable in the event that the publicly available information relied upon is subsequently found to be inaccurate. The opinions and financial analysis expressed in the study are not to be construed as providing investment or business advice. Brand Finance does not intend the study to be relied upon for any reason and excludes all liability to any body, government, or organisation.
The data presented in this study form part of Brand Finance's proprietary database, are provided for the benefit of the media, and are not to be used in part or in full for any commercial or technical purpose without written permission from Brand Finance.