
Every day at Brand Finance we are tasked with evaluating the strength of brands and marketing and valuing the impact of that strength. Within that task lies a requirement to answer different layers of questions including:
- What is a brand and what makes it strong?
- Why do brands and brand strength matter?
- What are the most popular brands?
- What can you do to build Brand Popularity and Strength? – The Brand Beta model
The following series of short articles is intended to explain how we do that and what that means for businesses.

1. What is a brand and what makes it strong?
In order to talk about what makes a brand strong and set up for growth, it’s important to briefly define what we mean by “brand”.
When we speak about brands in the context of accounting or law, we consider brands to be “trademarks and their associate intellectual property” with this intellectual property being designs, domains, art works etc that are linked to the use of the trade marks.
Trademarks themselves are “any sign capable of being represented graphically and which is capable of distinguishing goods or services dealt with or provided in the course of trade by a person from goods or services so dealt with or provided by any other person” [1]. In other words, in legal terms, trademarks are simply a signpost distinguishing one company, product or service from another.
As a result of this, “distinctiveness” from the signposts of another legal ‘person’ is the key determinant of whether a mark can be trademarked. Differentiation or reputation don’t even get a look-in, an important fact given the discussion in our industry on the importance of distinctiveness over differentiation in driving brand strength and growth.
However, the ability to trademark a brand does not necessarily mean that that brand is “strong”.
As my colleague at Brand Finance and Insights Director, Steve Thomson, has pointed in an article in April 2019 Brand Strength is “in laymen’s terms how ‘good’ the brand is, and the impact it has on stakeholders’ actions: whether to buy the product, what price to pay, whether to work for an organisation, etc”.
What this means is that brands are more than signposts. In reality, they are a unit of storage for the cumulative familiarity, reputation and appeal among all stakeholders (customers, employees, suppliers, investors and the external public) and a method for exploiting that familiarity, reputation and appeal through the use of clear, distinctive signposting.
This is why at Brand Finance we use the rounded definition of “A bundle of trademarks and associated IP which can be used to take advantage of the perceptions of all stakeholders to provide a variety of economic benefits to the entity”, when identifying brands in order to evaluate and value them.
Importantly, this highlights the fact that brands are there to satisfy customer needs better than the competition and to make money. The way they make money is to influence people to make decisions that are favourable to person, business, nation, organisation etc that they wouldn’t make for the same entity if it had a less strong brand.
Each stakeholder is different but customers are generally the most important, so this article focusses on them and how their view of brands affects profit-seeking businesses.
Among customers, the aim of brands is to make money and a strong brand will be one that stimulates the expansion of the demand curve when present compared to when not present. By stimulating additional demand, the brand has the effect of raising revenue and profit by either allowing for an increase in volume sold or price point or both.
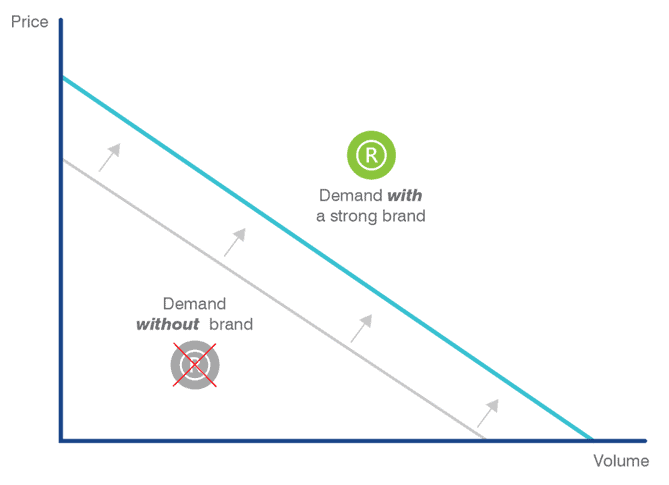
Brands do this by having a higher level of penetration and awareness, and by stimulating a higher rate of conversion among non-customers (trial) and customers (loyalty) than other brands. In other words, they get more people to buy more (preferably at a higher price).
This effect is well summarised within the ‘marketing funnel’. The marketing funnel is a key construct when analysing the impact of brands on business performance. Customers and other stakeholders need to be aware of brands to consider them. Following this, the features of the product, service, price, availability, image etc as well as in some cases the nature of promotional activities lead people to consider and ultimately purchase branded products and services. The marketing funnel encompasses these effects into a simplified structure which provides an overview of strength.
That is not to say it is a panacea. Tom Roach’s article helpfully summarised why an overemphasis on the marketing funnel can be problematic [2]. In particular, it can create issues when used as a measure of marketing effectiveness or to guide media choices. This is because it overlooks the feedback loop that each level has on another (e.g. usage leads to familiarity) and does not directly recognise that marketing and the purchase process rarely work in such a linear way.
That being said, according to our own research and that of other agencies [3], consideration has a very close relationship with sales and sales growth.
At Brand Finance, we have therefore created a model derived from our research of over 4,000 brands in over 30 sectors in over 40 countries, which can be used to predict sales growth as a result of long-term brand equity and awareness.
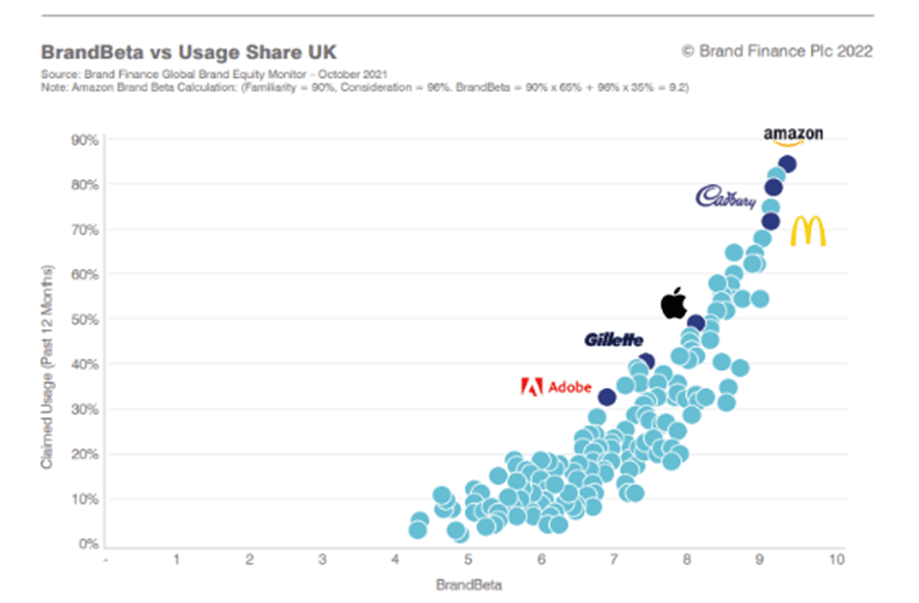
This model is called the BrandBeta® and is calculated as a combination of brand familiarity and consideration conversion, being the proportion of people familiar with a brand who are willing to consider it. The BrandBeta® model is highly predictive of share.
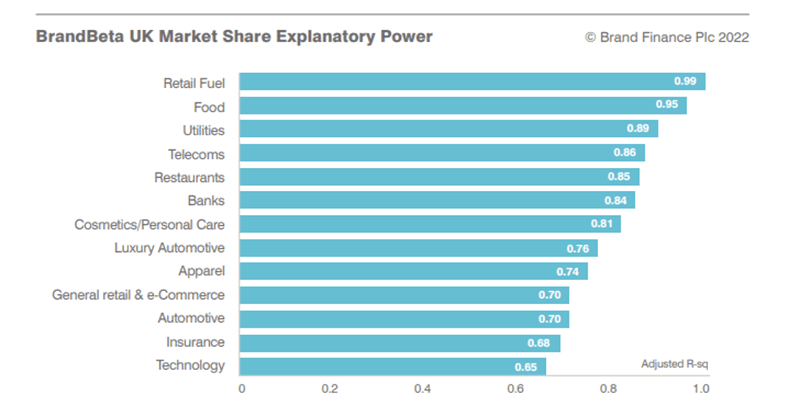
In fact, our analysis shows that, when combined, familiarity and consideration conversion explain over 80% of the variance in market share within the categories covered.
Analysing the impact of familiarity and consideration conversion, we noted that familiarity explains approximately 65% of the variance in share, while consideration conversion explains approximately 35%. BrandBeta® is therefore a combination of the two measures in the ratio (65:35).
This combination creates a score out of 10 which our additional analysis shows can be used to predict market share growth.
This relationship is across all countries and sectors although there are some small differences in the effects between them. The results for the UK can be seen below:
However, as well as this prediction of share we also need to understand the factors which drive consideration conversion and familiarity.
Marketing activities and past experiences influence familiarity while Brand attributes - such as quality, coolness, availability and trust – influence the likelihood to consider and should be researched. Within Brand Finance’s syndicated research we separate sectors in to in-depth (Tier 1) research sectors and high-level (Tier 2) research sectors.
Within “Tier 1” sectors, these explanatory brand attribute measures are researched. In the “Tier 2” sectors, additional research can be performed as necessary in order to give diagnostic detail on how to improve brand positioning and messaging to influence likelihood to consider and therefore purchase.
Even without these detailed metrics, however, brand strength in the minds of consumers can be summed up by this BrandBeta® figure and later explained more thoroughly through the use of more in-depth research.
BrandBeta® refers to the position of brands within customers minds – awareness and perceptions. This is how the brand is currently perceived by customers and as I have stated, this is an essential part of any brand evaluation.
That being said, a full understanding of a brand’s strength requires an understanding of all stakeholders. It also requires an understanding of the ‘inputs’ (in the form of marketing activities and brand/product attributes) that will influence perceptions in to the future as well as an understanding of whether perceptions are having the desired effect on outcomes (i.e. the demand curve mentioned above). This is neatly summarised in a “Brand Strength Index” about which I talk in a separate article [4].
[1] Section 2 of the Singapore Trade Marks Act
[2] Tom Roach, 01/09/2021, The sales funnel is wrong but it’s here to stay, so let’s fix it., https://thetomroach.com/2021/09/01/the-sales-funnel-is-wrong-but-its-here-to-stay-lets-fix-it/
[3] Gain Theory, 2018, The Long Term Impact of Media Investment, https://www.gaintheory.com/the-long-term-impact-of-media-investment/
[4] Alex Haigh, 02 December 2021, Brand Strength Index: Creating a scorecard for your brand, https://brandfinance.com/insights/brand-strength-index-creating-a-scorecard-for-your-brand
2. Why do brands and brand strength matter?

Brand Strength is “in laymen’s terms how ‘good’ the brand is, and the impact it has on stakeholders’ actions: whether to buy the product, what price to pay, whether to work for an organisation, etc” and brands are the tool by which this strength is harnessed and exploited.
BrandBeta is a composite metric combining brand familiarity and consideration to purchase among those familiar. Together, the measure shows a strong relationship with usage and market share for brands in many markets.
BrandBeta’s more in-depth cousin the “Brand Strength Index” digs deeper into what is causing the BrandBeta results and also benchmarking its success in causing improved performance on the value drivers for the branded business/organisation.
Given that the intention of most marketers working for profit-seeking firms is to increase demand, BrandBeta and Brand Strength more generally can therefore be considered key concepts and useful to see how marketing’s activity changes the needle.
This relevance can be shown quite clearly by the use of two example industries.
BrandBeta in action: the US car industry
Over the last five years we have researched the car-buying public in around 20 countries per year, including in the United States of America.
The graph below shows the results of all automobile brands in the US car market according to our BrandBeta score compared against their market share in the relevant year.
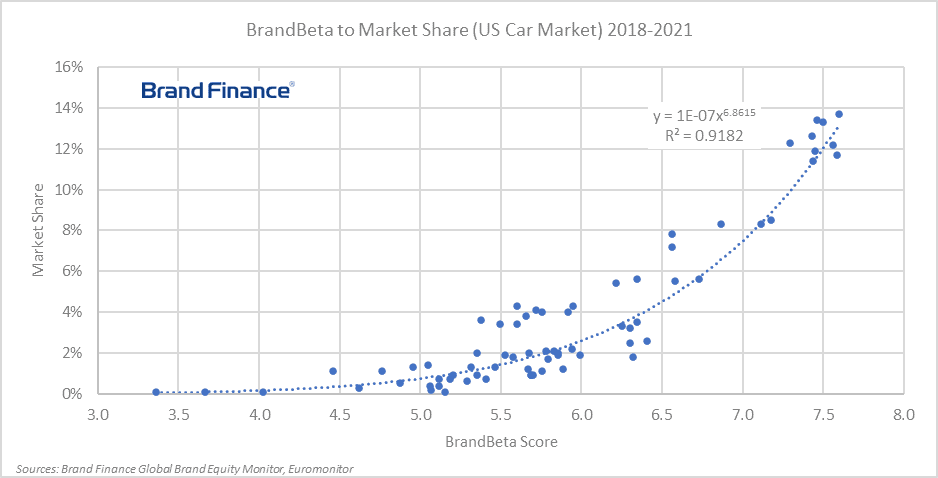
The R2 figure shows the fit of the results to the trendline with a number closer to 1 indicating a perfect fit. The figure is above 0.9 indicating a very strong relationship as we have seen in virtually all sectors in all markets.
What is particularly interesting with this set of data is that there appears to be a double jeopardy rule. In other words, the higher a brand’s familiarity and consideration the more their market share will grow per additional unit of familiarity and consideration.
As others have recognised, this can be explained by a tendency for larger brands to have higher loyalty.
It also appears to us to be because consumers have a closer understanding and relationship with larger brands and are more able to positively differentiate their offer from others. In other words, not only are more people familiar with the brands but that the people who are familiar are each individually more familiar with the brands too.
The implications of this finding is that in many cases, a branded business which wants to make sure it is maximising its impact may want to focus itself on markets where it can dominate rather than spreading itself thinly across multiple markets where it is dominant in none.
BrandBeta in action: Banks in ASEAN
To highlight this effect in a different way, I have selected a data set relevant to my role as Managing Director of Brand Finance Asia Pacific – Banks in the countries of the Association of South East Asian Nations (ASEAN).
We regularly research bank brands in Indonesia, Thailand, Malaysia, Vietnam and Singapore and have this year started to do the same in the Philippines. The below graph shows results for the former 5 markets last year compared to the year before.
Rather than showing overall numbers for BrandBeta and market share, it shows the relationship between changes in each on the other. In other words, it shows whether you should expect usage increases if you have an increase in BrandBeta.

The results show that the short answer is that yes, you should. The R2 figure which shows the strength of the relationship is 0.53 meaning that usage can be expected to increase as BrandBeta increases and that can be expected the majority of the time. As you can see in the top left and bottom right quadrants there are some outliers but not many.
What this helps to show is that the relationship is not circumstantial but that as you improve brand beta, your market share is likely to move positively too.
What does this mean?
BrandBeta, and more importantly, the measures that underpin it are therefore key measures to track. What is useful about it too is that, by requiring a very small number of measures, it can drastically decrease a tracking budget.
As a result, you can track a brand regularly for a limited budget. This can free up budget to only invest in a larger diagnostic tracker, brand strength index and even brand valuation every year when the budgeting cycle comes up for review or if there is a big change in the measures within BrandBeta that needs explanation while also providing some core brand health KPIs that can be used for analytics like marketing mix modelling.
3. What are the most popular brands?

At Brand Finance we’re known for our rankings and in that respect, this analysis doesn’t disappoint. And while rankings are not the only concern one should have, they can clearly be useful for understanding one’s performance.
In the table below you can see the top brands by BrandBeta in each country where we have researched at least 10 sectors. These can also be considered the “Most Popular” given that they are the ones most well known and most likely to be considered among all brands researched.
| Brand | Sector | Country of Research | Brand Beta | Country Rank |
| Checkers | Supermarkets | South Africa | 9.95 | 1 |
| Carrefour | Supermarkets | UAE | 9.75 | 1 |
| Media | Mexico | 9.74 | 1 | |
| Media | Indonesia | 9.69 | 1 | |
| Migros | Supermarkets | Switzerland | 9.66 | 1 |
| Media | Vietnam | 9.64 | 1 | |
| Petrobras | Oil & Gas | Brazil | 9.60 | 1 |
| Media | Spain | 9.57 | 1 | |
| ICA | Supermarkets | Sweden | 9.53 | 1 |
| Woolworths | Supermarkets | Australia | 9.53 | 1 |
| Media | Italy | 9.53 | 1 | |
| Turkish Airlines | Airlines | Turkey | 9.51 | 1 |
| Samsung | Technology | South Korea | 9.47 | 1 |
| Big C | Supermarkets | Thailand | 9.46 | 1 |
| Shell | Oil & Gas | Malaysia | 9.43 | 1 |
| Shopee | General retail | Singapore | 9.39 | 1 |
| Royal Mail | Logistics | UK | 9.33 | 1 |
| Saudia | Airlines | Saudi Arabia | 9.30 | 1 |
| Asahi | Beer | Japan | 9.27 | 1 |
| Amazon | General retail | India | 9.27 | 1 |
| Media | Canada | 9.26 | 1 | |
| Albert Heijn | Supermarkets | Netherlands | 9.20 | 1 |
| McDonald's | Restaurants | USA | 9.19 | 1 |
| Media | France | 9.18 | 1 | |
| Lidl | Supermarkets | Germany | 8.96 | 1 |
| China Mobile | Telecoms | China | 8.37 | 1 |
Source: Brand Finance Global Brand Equity Monitor October 2022
What you can see from the list of brands and countries is the prevalence of brands from certain sectors. In particular, Supermarkets/Retail make up 10 of the most popular brands in the 26 countries and Media makes up 8.
Brands in these high usage, low cost (or in the case of media nil cost) sectors tend to have higher familiarity and consideration than other sectors – for example banking or insurance where there is often low day-to-day interest in brands or automobiles where regularity of purchase is low. It is therefore useful to look by sector and even by sector within country since this can be used to compare against market share more effectively.
Unfortunately, given the space I have I cannot list the ranks of the most popular brands in all sectors and countries we have researched for Brand Finance’s Global Brand Equity Monitor database so I will focus on some special sectors close to my home here in Asia.
Looking at Banks in Singapore, market leaders DBS/POSB clearly lead the pack, with DBS commanding a BrandBeta score more than 1 pt above OCBC. DBS’ brand value is almost double that of each of OCBC and UOB, a fact which is explained in large part by this difference in popularity.
| Brand | Sector | Country of Research | Brand Beta | Country // Sector Rank |
| DBS Bank | Banks | Singapore | 8.93 | 1 |
| POSB | Banks | Singapore | 8.76 | 2 |
| OCBC Bank | Banks | Singapore | 7.80 | 3 |
| UOB | Banks | Singapore | 7.40 | 4 |
| Standard Chartered | Banks | Singapore | 6.51 | 5 |
Source: Brand Finance Global Brand Equity Monitor October 2022
DBS, initials which originally stood for the Development Bank of Singapore, has been an important part of Singapore’s miracle growth story from independence. Since 2009, when it installed current CEO Piyush Gupta after 10 bumpy years with 5 different CEOs, it has transformed itself in to a regionally leading bank with customer-centricity at its core and leading the charge towards digitalisation in banking. As a result, it has largely staved off challenges from the 5 recently accredited digital banks in Singapore and strengthened its lead against the other members of the big 3 – OCBC and UOB – in Singapore.
Moving to Australia, if we review the Telecoms sector we can see how Telstra is not only leading but is increasing its lead as Optus was hit by a massive data leak late in 2022.
| Brand | Sector | Country of Research | Brand Beta | Country // Sector Rank | Brand Beta Growth |
| Telstra | Telecoms | Australia | 8.02 | 1 | 3% |
| Optus | Telecoms | Australia | 7.26 | 2 | -4% |
| nbn | Telecoms | Australia | 7.12 | 3 | 0% |
| Vodafone | Telecoms | Australia | 6.33 | 4 | -1% |
Source: Brand Finance Global Brand Equity Monitor October 2022
Optus, which happens to be a subsidiary of Singapore-based Singtel, and is the second largest Telecoms company in Australia, was hit by a data breach back in September 2022. This led to the release of large quantities of personal data on about 40% of Australia’s population (10 million people). As a result of the breach, Optus’ customer loyalty and perceptions of trust are significantly down and as a result so is its popularity – a sign of an important trend.
As you can see, this BrandBeta® metric can be a useful way to show popularity between brands and track performance year on year. The results can be analysed across category and country and by reviewing the results regularly, you can have a good sense of whether things are going wrong or right. And if they’re not going well, a warning to do something about it.
4. What can you do to build Brand Popularity and Strength? The Brand Beta Model
At Brand Finance, we spend our time analysing the impact of brand reputation on financial performance and on how businesses can use marketing spend, brand strategy and other tools to maximise that impact. We therefore feel we are in a uniquely privileged position to identify what drives people towards choosing one brand rather than another.
As we have established previously through our Brand Beta analysis, brands are able to impact the performance of a business firstly if they are well known and understood and secondly when they command certain perceptions in people’s minds that positively influence their likelihood to purchase or interact with them.
There are different models to explain this, some more complicated than others. However, as I’ve mentioned, in general there are two core points driving the popularity and therefore growth in brands.
- Awareness and Recall at the point of sale or consideration
- Relevant/Meaningful Differentiation while considering.
Our Brand Beta analysis has shown the first point to be approximately twice as important as the second. However, there continues to be argument about this relative importance.
In particular, there is contention over what constitutes relevant differentiation. This is why I have made the deliberate distinction between functional and emotional differentiation in the model below since the ability of brands to differentiate on emotional factors is an area of dispute.
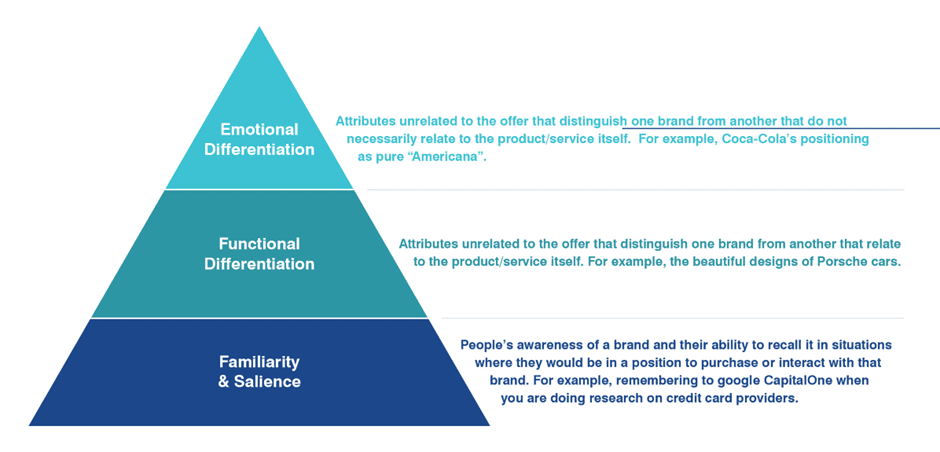
Title: The Brand Strength Pyramid. Source: Brand Finance
At the foot of the pyramid is familiarity and salience.
Salience refers to the situation whereby the brand is immediate to the mind of people at the point when they would choose that brand over others. While this represents something a little beyond brand familiarity, it is related concept and encompasses general awareness too.
As Jenna Romaniuk, Byron Sharp and the rest of the Ehrenberg-Bass Institute point out[1], this Salience is often created and reinforced by brands that are distinctive – i.e. easily distinguishable in people’s minds from other brands – as opposed to differentiated. That is, that they have “assets” – for example slogans, colours, patterns, sounds, mascots etc – that help them be more memorable and easier to distinguish. These assets only become powerful and distinctive through continued, consistent use where they are widely seen by the public. In particular, where these assets are widely advertised or promoted over a long period of time.
The implication of this is that products and companies should not change their slogans, mascots, designs etc too often. Assets that are imperfect but consistent and well known may be more powerful than a modernised design or a strapline which explains slightly better the purpose or new positioning of the brand.
Additionally, companies and products should be rebranded as infrequently as possible. Even minor name changes create big mental inconsistencies that are often difficult and costly to recover. A full name change in particular is more often than not a significant destroyer of value.
You can see this effect in the recent rebrand in 2021 of TOTAL to TotalEnergies. What seems like a small change was not widely understood by the public. Taking a sample of 5 European countries, we found that in the year of the rebrand there was significantly lower familiarity towards the new brand despite it being widely used. Over the following year, large amounts of investment were needed to build familiarity back up to its previous level.
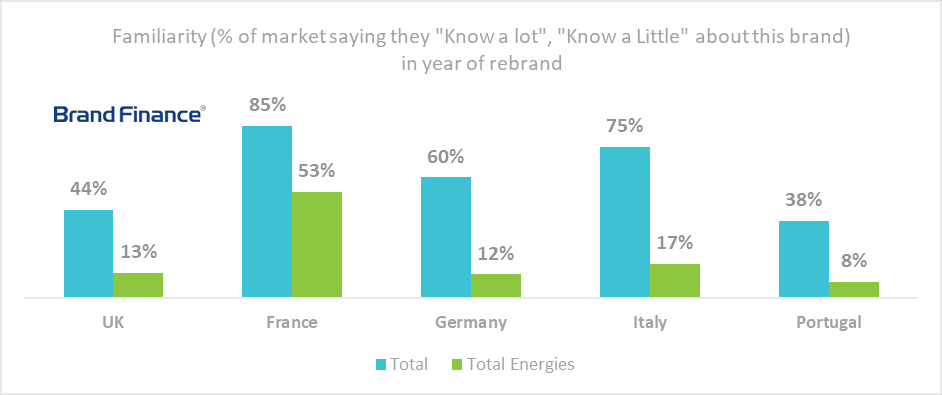
Source: Brand Finance Global Brand Equity Monitor
The exceptions to this destruction of value are where the company is rebranded to a brand that is (or will very soon be) better known and liked than the one it is replacing or where the company is associated with a scandal so great that its brand is irreparably damaging to the business. Although in the latter example the irreparability criterion is rarely reached.
Additional to consistent, widespread promotion, our own previous work on this subject for clients finds that these assets are significantly more effective when they are applied to a high standard. For example, where petrol forecourts are appropriately painted and the brand identity properly applied, we have found significant uplifts in demand compared to those forecourts with the same brand but a visual identity applied to a lower and less consistent quality.
Moving beyond salience in the pyramid, there are the two types of differentiation “Emotional” and “Functional”.
Additionally to being distinctive, brands are strong because they are associated with positive attributes of the branded offer. These attributes can relate to both the functional qualities of the product or service offer or they can relate to more emotional attributes (like the positive perceptions of being independently owned or saying something about one’s own self-identity). In both cases, these are assumed and therefore not totally rational.
These areas of differentiation can be found via market research and plotted on a correspondence map to identify relative positioning of each brand. It is worth doing so in order to identify what is driving customer purchase among different target audiences and where a specific brand is doing well or badly.
However, it is easy to overstate the importance of being different. Using the banking industry as an example, Brand Finance’s Global Brand Equity Monitor study of 722 banking brands in 35 different markets, we find a weak relationship between the percentage of respondents who say the brand “Genuinely Offers Something Different” and their consideration to purchase.
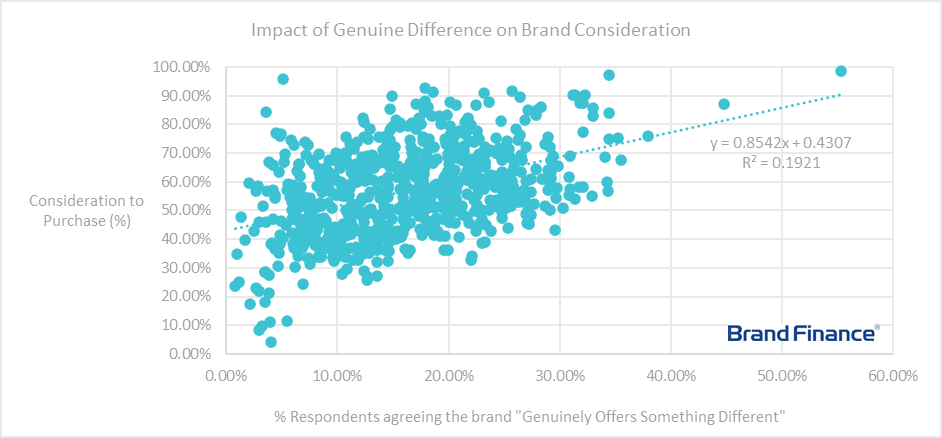
Source: Brand Finance Global Brand Equity Monitor
The graph above plots % of respondents agreeing the brand “Genuinely Offers Something Different” versus their consideration to purchase. We note a positive relationship but one where this measure only explains 19% (0.1921) of variance, indicating a weak relationship.
Additionally, many of the brands that strengthen the relationship are fintech brands like GCash a payment service in the Philippines or Revolut – a British Fintech company – which do not, in any case, offer a full service banking offer. This means that being genuinely different is an even weaker predictor of choice in banking than the graph suggests.
But before you say that banking is a particularly unique industry in within which people value steady predictability, we have found this relationship in other sectors too. Having completed this analysis also on the car industry across the 18 markets we research, I can confirm that the relationship is no stronger there. Only about 18% of variance is explained by this measure.
In reality, this is unsurprising. The biggest and most popular brands will come to dominate the market, begin to resemble it and therefore no longer be different. Difference is the victim of success. Uber started off as offering something different to the market but is now so dominant that it just represents it. Over time, difference recedes in importance and something else becomes more important.
What that something else is, however, a source of discussion. Byron Sharp’s books make the case that acquisition is everything, acquisition is largely driven by mental and physical availability (as opposed to differentiation) and that loyalty is more or less just a function of size. This implies that a focus on any sort of differentiation or on improving perceived experience is wasteful when you could focus on improving salience and distribution.
Our Brand Beta analysis highlights that familiarity and therefore mental availability are important for demand but that customers also do differentiate among the brands that they know of and have an ability to purchase.
It is therefore important, at least to a certain extent, to build positive perceptions of your brand and its offer so as not to dissuade those who would otherwise be acquired as a result of your brand’s salience. This creates preference both among new potential buyers and also maintains it among current customers, helping to influence loyalty – at least a little bit!
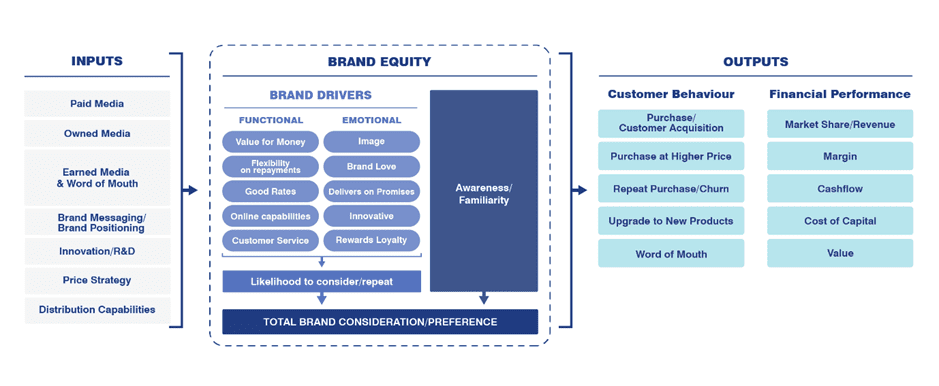
Title: Brand Value Chain. Source: Brand Finance
Our “Brand Value Chain” schematic above helps to show what this means for people who are trying to build brands.
Paid, earned and owned media need to be managed appropriately in order to build Awareness, Familiarity and Salience. These media exposures need to be sustained at a high level for a long period of time. Within short time periods (i.e. months) there is declining effectiveness as multiple exposures to the same audience have diminishing effects.
However, over long periods, all things being equal (e.g. the effectiveness of the advertising) more is better since the more you spend, the more economies of scale you receive in the form both of discounts from media but also in terms of the memorability of advertising.
Additionally, the likelihood to consider needs to be built among those with whom salience already exists. This should be built through a segmentation, targeting and positioning approach whereby the brand’s offer (its “personality” as well as its price, distribution and other functional factors) are matched with those customers that are likely to be in the market for a product or service of the type you are able to offer.
Salience and positive perceptions (i.e. emotional and functional differentiation) therefore need to be built together.
Related to this, one interesting point to end on is the impact of failing to promote your brand. There have been various studies on the impact of stopping advertising but a recent one by the Ehrenberg-Bass Institute reviewed 70 consumer goods brands in Australia in order to see the impact on sales of stopping advertising completely. They found that when you stop promoting brands entirely, sales volume starts to reduce immediately and on average reduces by about 15% a year.
| Index Year | 1 | 2 | 3 | 4 | 5 | 6 | 7 | 8 | Average | |
| Mean Sales Index | 100 | 84 | 75 | 64 | 46 | 42 | 37 | 32 | 28 | - |
| Standard Deviation | - | 33 | 50 | 42 | 30 | 24 | 25 | 23 | 18 | - |
| % Mean Sales change | - | -16% | -11% | -15% | -28% | -9% | -12% | -14% | -13% | -15% |
Source: Adapted from University of South Wales Ehrenberg-Bass Institute,
https://www.marketingscience.info/when-brands-stop-advertising/
This highlights the long-term value of brands. Promotional activities are needed to replenish the stock of salience. Good brand governance, a clear customer proposition, consistent, memorable messaging and a strong product, price and ability to distribute make those promotional activities effective and build differentiation.
However, these activities have effects beyond the current year. They are an investment in the future performance and growth of the business. Therefore the acts of identifying the sources of that value, its potential to depreciate and then the level of investment needed to improve value are a necessary part of understanding, managing and building long-term effectiveness.
So, in short, building brands is a marathon, not a sprint. It needs long-term investment in promotion which is consistent, memorable and includes familiar cues (“assets”) but it also needs a clear customer proposition which is effectively delivered. What this proposition should be and how much you in particular should spend to promote it, however, is the next question. Please get in touch so we can help you figure that out!
References:
- Romaniuk J, 2018, Building Distinctive Brand Assets, Oxford University Press
For more information about how we evaluate brands, visit Brand Valuation Methodology | Brandirectory